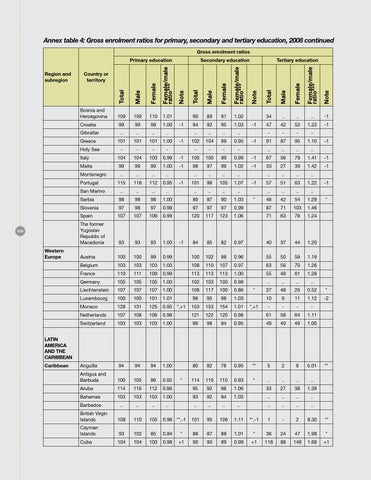
Annex table 4: Gross enrolment ratios for primary, secondary and tertiary education, 2008 continued Gross enrolment ratios Primary education Region and subregion
Bosnia and Herzegovina
109
109
110
1.01
Croatia
99
99
98
1.00
Gibraltar
..
..
..
..
101
101
101
1.00
-
-
-
-
Italy
104
104
103
0.99
Malta
99
99
99
1.00
Montenegro
..
..
..
..
115
118
112
0.95
..
..
..
..
Greece
Portugal San Marino
Western Europe
Tertiary education
Country or territory
Holy See
120
Secondary education
90
89
91
1.02
94
92
95
1.03
..
..
..
..
102
104
99
0.95
-
-
-
-
-1
100
100
99
0.99
-1
98
97
99
1.02
..
..
..
..
101
98
105
1.07
..
..
..
..
-1 -1
-1
34
..
..
..
-1
47
42
52
1.22
-1
-
-
-
-
91
87
95
1.10
..
..
..
..
-1
67
56
79
1.41
-1
-1
33
27
39
1.42
-1
..
..
..
..
57
51
63
1.22
..
..
..
..
-1 -1
-1
Serbia
98
98
98
1.00
89
87
90
1.03
48
42
54
1.29
Slovenia
97
98
97
0.99
97
97
97
0.99
87
71
103
1.46
Spain
107
107
106
0.99
120
117
123
1.06
71
63
78
1.24
The former Yugoslav Republic of Macedonia
93
93
93
1.00
84
85
82
0.97
40
37
44
1.20
Austria
100
100
99
0.99
100
102
98
0.96
55
50
59
1.19
-1
*
Belgium
103
103
103
1.00
108
110
107
0.97
63
56
70
1.26
France
110
111
109
0.99
113
113
113
1.00
55
48
61
1.28
Germany
105
105
105
1.00
102
103
100
0.98
Liechtenstein
107
107
107
1.00
108
117
100
0.86
Luxembourg
100
100
101
1.01
96
95
98
1.03
* *,+1
-1
-1 *
..
..
..
..
37
48
25
0.52
*
10
9
11
1.12
-2
Monaco
128
131
125
0.95 *,+1
153
153
154
1.01
-
-
-
-
Netherlands
107
108
106
0.98
121
122
120
0.98
61
58
64
1.11
Switzerland
103
103
103
1.00
96
98
94
0.95
49
49
49
1.00
Anguilla
94
94
94
1.00
80
82
78
0.95
**
5
2
8
5.01
Antigua and Barbuda
100
105
96
0.92
114
119
110
0.93
*
..
..
..
..
LATIN AMERICA AND THE CARIBBEAN Caribbean
*
**
Aruba
114
116
112
0.96
95
92
98
1.06
33
27
38
1.39
Bahamas
103
103
103
1.00
93
92
94
1.03
..
..
..
..
Barbados
..
..
..
..
..
..
..
..
..
..
..
..
British Virgin Islands
108
110
105
0.96 **,-1
101
95
106
1.11
**,-1
1
-
2
8.30
**
Cayman Islands
93
102
85
0.84
*
88
87
88
1.01
*
36
24
47
1.98
*
Cuba
104
104
103
0.98
+1
90
90
89
0.99
+1
118
88
149
1.68
+1