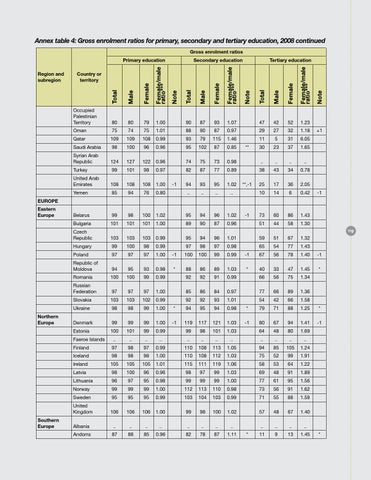
Annex table 4: Gross enrolment ratios for primary, secondary and tertiary education, 2008 continued Gross enrolment ratios Primary education Region and subregion
Secondary education
Tertiary education
Country or territory
Occupied Palestinian Territory
80
80
79
1.00
90
87
93
1.07
47
42
52
1.23
Oman
75
74
75
1.01
88
90
87
0.97
29
27
32
1.18
Qatar
109
109
108
0.99
93
79
115
1.46
Saudi Arabia
98
100
96
0.96
95
102
87
0.85
Syrian Arab Republic
124
127
122
0.96
74
75
73
0.98
..
..
..
..
Turkey
99
101
98
0.97
82
87
77
0.89
38
43
34
0.78
United Arab Emirates
108
108
108
1.00
94
93
95
1.02
25
17
36
2.05
Yemen
85
94
76
0.80
..
..
..
..
10
14
6
0.42
Belarus
99
98
100
1.02
95
94
96
1.02
73
60
86
1.43
Bulgaria
101
101
101
1.00
89
90
87
0.96
51
44
58
1.30
Czech Republic
103
103
103
0.99
95
94
96
1.01
59
51
67
1.32
-1
**
**,-1
11
5
31
6.05
30
23
37
1.65
+1
-1
EUROPE Eastern Europe
Northern Europe
119
Hungary
99
100
98
0.99
97
98
97
0.98
65
54
77
1.43
Poland
97
97
97
1.00
-1
100
100
99
0.99
-1
67
56
78
1.40
-1
Republic of Moldova
94
95
93
0.98
*
88
86
89
1.03
*
40
33
47
1.45
*
Romania
100
100
99
0.99
92
92
91
0.99
66
56
75
1.34
Russian Federation
97
97
97
1.00
85
86
84
0.97
77
66
89
1.36
Slovakia
103
103
102
0.99
92
92
93
1.01
54
42
66
1.58
Ukraine
98
98
99
1.00
*
94
95
94
0.98
*
79
71
88
1.25
*
Denmark
99
99
99
1.00
-1
119
117
121
1.03
-1
80
67
94
1.41
-1
Estonia
100
101
99
0.99
99
98
101
1.03
64
48
80
1.69
..
..
..
..
..
..
..
..
..
..
..
..
Faeroe Islands
Southern Europe
-1
Finland
97
98
97
0.99
110
108
113
1.05
94
85
105
1.24
Iceland
98
98
98
1.00
110
108
112
1.03
75
52
99
1.91
Ireland
105
105
105
1.01
115
111
119
1.06
58
53
64
1.22
Latvia
98
100
96
0.96
98
97
99
1.03
69
48
91
1.89
Lithuania
96
97
95
0.98
99
99
99
1.00
77
61
95
1.56
Norway
99
99
99
1.00
112
113
110
0.98
73
56
91
1.62
Sweden
95
95
95
0.99
103
104
103
0.99
71
55
88
1.59
United Kingdom
106
106
106
1.00
99
98
100
1.02
57
48
67
1.40
Albania
..
..
..
..
..
..
..
..
Andorra
87
88
85
0.96
82
78
87
1.11
*
..
..
..
..
11
9
13
1.45
*