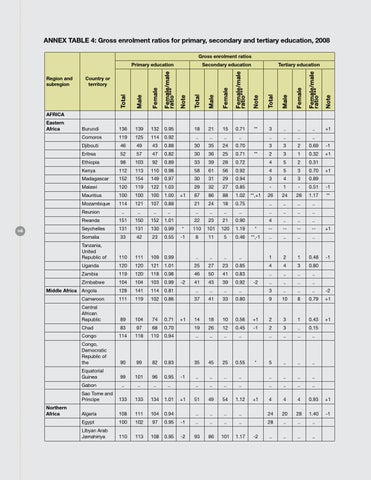
Annex table 4: Gross enrolment ratios for primary, secondary and tertiary education, 2008 Gross enrolment ratios Primary education Region and subregion
Secondary education
Tertiary education
Country or territory
AFRICA Eastern Africa
116
Middle Africa
Northern Africa
Burundi
136
139
132
0.95
18
21
15
0.71
Comoros
119
125
114
0.92
..
..
..
..
..
..
..
..
Djibouti
46
49
43
0.88
30
35
24
0.70
3
3
2
0.69
-1 +1
Eritrea
52
57
47
0.82
30
36
25
0.71
Ethiopia
98
103
92
0.89
33
39
28
0.72
**
**
3
..
..
..
2
3
1
0.32
4
5
2
0.31
+1
Kenya
112
113
110
0.98
58
61
56
0.92
4
5
3
0.70
Madagascar
152
154
149
0.97
30
31
29
0.94
3
4
3
0.89
Malawi
120
119
122
1.03
29
32
27
0.85
-
1
-
0.51
-1
26
24
28
1.17
**
..
..
..
..
Mauritius
100
100
100
1.00
Mozambique
114
121
107
0.88
+1
87
86
88
1.02
21
24
18
0.75
**,+1
Reunion
..
..
..
..
..
..
..
..
..
..
..
..
Rwanda
151
150
152
1.01
22
23
21
0.90
4
..
..
..
Seychelles
131
131
130
0.99
*
110
101
120
1.19
*
--
--
--
--
Somalia
33
42
23
0.55
-1
8
11
5
0.46
**,-1
..
..
..
..
Tanzania, United Republic of
110
111
109
0.99
..
..
..
..
1
2
1
0.48
Uganda
120
120
121
1.01
25
27
23
0.85
4
4
3
0.80
Zambia
119
120
118
0.98
46
50
41
0.83
..
..
..
..
-2
-2
+1
+1
-1
Zimbabwe
104
104
103
0.99
41
43
39
0.92
..
..
..
..
Angola
128
141
114
0.81
..
..
..
..
3
..
..
..
-2
Cameroon
102
0.86
37
41
33
0.80
9
10
8
0.79
+1
+1
111
119
Central African Republic
89
104
74
0.71
14
18
10
0.56
+1
2
3
1
0.43
Chad
83
97
68
0.70
19
26
12
0.45
-1
2
3
..
0.15
..
..
..
..
5
..
..
..
+1
Congo
114
118
110
0.94
..
..
..
..
Congo, Democratic Republic of the
90
99
82
0.83
35
45
25
0.55
Equatorial Guinea
99
101
96
0.95
Gabon
..
..
..
..
Sao Tome and Principe
133
133
134
1.01
Algeria
108
111
104
0.94
Egypt
100
102
97
Libyan Arab Jamahiriya
110
113
108
-1
*
..
..
..
..
..
..
..
..
..
..
..
..
..
..
..
..
+1
51
49
54
1.12
4
4
4
0.93
+1
..
..
..
..
24
20
28
1.40
-1
0.95
-1
..
..
..
..
28
..
..
..
0.95
-2
93
86
101
1.17
..
..
..
..
+1
-2