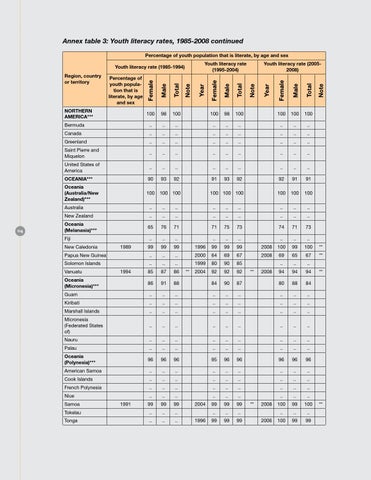
Annex table 3: Youth literacy rates, 1985-2008 continued Percentage of youth population that is literate, by age and sex Youth literacy rate (1995-2004)
Youth literacy rate (1985-1994) Region, country or territory
Percentage of youth population that is literate, by age and sex
NORTHERN AMERICA***
114
Youth literacy rate (20052008)
100
98
100
100
98
100
100
100
100
Bermuda
..
..
..
..
..
..
..
..
..
Canada
..
..
..
..
..
..
..
..
..
Greenland
..
..
..
..
..
..
..
..
..
Saint Pierre and Miquelon
..
..
..
..
..
..
..
..
..
United States of America
..
..
..
..
..
..
..
..
..
OCEANIA***
90
93
92
91
93
92
92
91
91
Oceania (Australia/New Zealand)***
100
100 100
100 100 100
100
100
100
Australia
..
..
..
..
..
..
..
..
..
New Zealand
..
..
..
..
..
..
..
..
..
Oceania (Melanasia)***
65
76
71
71
75
73
74
71
73
Fiji
..
..
..
99
99
99
Papua New Guinea
..
..
Solomon Islands
..
..
85
87
86
86
91
88
New Caledonia
Vanuatu
1989
1994
Oceania (Micronesia)***
..
..
..
..
..
..
1996
99
99
99
2008
100
99
100
**
..
2000
64
69
67
2008
69
65
67
**
..
1999
80
90
85
..
..
..
2004
92
92
92
94
94
94
84
90
87
80
88
84
**
**
2008
Guam
..
..
..
..
..
..
..
..
..
Kiribati
..
..
..
..
..
..
..
..
..
Marshall Islands
..
..
..
..
..
..
..
..
..
Micronesia (Federated States of)
..
..
..
..
..
..
..
..
..
Nauru
..
..
..
..
..
..
..
..
..
Palau
..
..
..
..
..
..
..
..
..
Oceania (Polynesia)***
96
96
96
95
96
96
96
96
96
American Samoa
..
..
..
..
..
..
..
..
..
Cook Islands
..
..
..
..
..
..
..
..
..
French Polynesia
..
..
..
..
..
..
..
..
..
Niue
..
..
..
99
99
99
Tokelau
..
..
..
Tonga
..
..
..
Samoa
1991
2004 1996
..
..
..
99
99
99
..
..
..
99
99
99
**
2008 2006
..
..
..
100
99
100
..
..
..
100
99
99
**
**