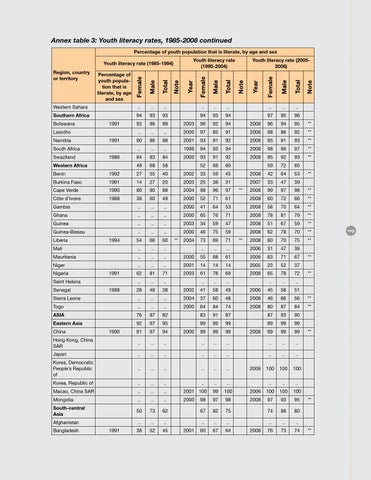
Annex table 3: Youth literacy rates, 1985-2008 continued Percentage of youth population that is literate, by age and sex Youth literacy rate (1995-2004)
Youth literacy rate (1985-1994) Region, country or territory
Percentage of youth population that is literate, by age and sex
Western Sahara
..
Southern Africa Botswana
..
..
..
..
93
94
92
94
..
93
93
86
89
..
..
..
2000
97
85
91
2008
98
86
92
**
1991
90
86
88
2001
93
91
92
2008
95
91
93
**
..
..
..
1996
94
93
94
2008
98
96
97
**
1986
84
83
84
2000
93
91
92
2008
95
92
93
**
48
68
58
52
68
60
59
72
65
Western Africa
94
..
94
2003
96
..
92
South Africa Swaziland
..
1991
Lesotho Namibia
Youth literacy rate (20052008)
2008
97
95
96
96
94
95
Benin
1992
27
55
40
2002
33
59
45
2008
42
64
53
Burkina Faso
1991
14
27
20
2003
25
38
31
2007
33
47
39
**
**
**
Cape Verde
1990
86
90
88
2004
98
96
97
2008
99
97
98
**
Côte d’Ivoire
1988
38
60
49
2000
52
71
61
2008
60
72
66
** **
Gambia
..
..
..
2000
41
64
53
2008
58
70
64
Ghana
..
..
..
2000
65
76
71
2008
78
81
79
**
Guinea
..
..
..
2003
34
59
47
2008
51
67
59
**
Guinea-Bissau
..
..
..
2000
46
75
59
2008
62
78
70
**
54
66
60
2004
73
69
71
2008
80
70
75
**
..
..
..
2006
31
47
39
2000
55
68
61
2008
63
71
67
Liberia
1994
Mali
..
..
..
Mauritania
..
..
..
Niger Nigeria
1991
Saint Helena Senegal
1988
Sierra Leone
..
..
2001
14
14
14
2005
23
52
37
81
71
2003
61
78
69
2008
65
78
72
..
..
..
..
..
..
..
..
..
28
49
38
2002
41
58
49
2006
45
58
51
..
..
..
2004
37
60
48
2008
46
66
56
**
2000
64
84
74
2008
**
83
91
87
..
..
..
76
87
82
92
97
95
91
97
94
Hong Kong, China SAR
..
..
Japan
..
Korea, Democratic People’s Republic of Korea, Republic of
1990
99
99
99
99
99
99
..
..
..
..
..
..
..
..
..
..
..
..
2000
80
87
84
87
93
90
99
99
99
99
99
99
..
..
..
..
..
..
..
..
..
..
..
..
100
100
100
..
..
..
..
..
..
2008
2008
Macao, China SAR
..
..
..
2001 100
99
100
2006
100
100
100
Mongolia
..
..
..
2000
98
97
98
2008
97
93
95
South-central Asia
50
73
62
67
82
75
74
86
80
Afghanistan
..
..
..
..
..
..
..
..
..
38
52
45
60
67
64
76
73
74
Bangladesh
1991
**
..
Togo Eastern Asia
**
62
ASIA China
**
2001
2008
**
**
**
**
109