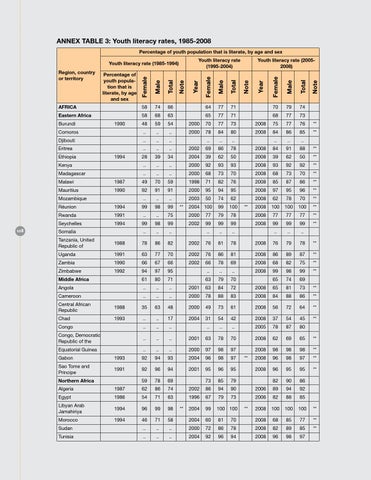
Annex table 3: Youth literacy rates, 1985-2008 Percentage of youth population that is literate, by age and sex Youth literacy rate (1995-2004)
Youth literacy rate (1985-1994) Region, country or territory
Percentage of youth population that is literate, by age and sex
AFRICA
58
Eastern Africa
74
66
64
77
71
70
79
74
58
68
63
65
77
71
68
77
73
48
59
54
2000
70
77
73
2008
75
77
76
**
Comoros
..
..
..
2000
78
84
80
2008
84
86
85
**
Djibouti
..
..
..
..
..
..
..
..
..
Burundi
1990
Eritrea Ethiopia
1994
Kenya Madagascar
..
..
..
2002
69
86
78
2008
84
91
88
**
28
39
34
2004
39
62
50
2008
39
62
50
**
..
..
..
2000
92
93
93
2008
93
92
92
**
..
..
..
2000
68
73
70
2008
68
73
70
**
Malawi
1987
49
70
59
1998
71
82
76
2008
85
87
86
**
Mauritius
1990
92
91
91
2000
95
94
95
2008
97
95
96
**
..
..
..
2003
50
74
62
2008
62
78
70
**
Mozambique
108
Youth literacy rate (20052008)
RĂŠunion
1994
99
98
99
2004 100
99
100
2008
100
100
100
**
Rwanda
1991
..
..
75
2000
77
79
78
2008
77
77
77
**
Seychelles
1994
99
98
99
2002
99
99
99
2008
99
99
99
**
..
..
..
..
..
..
..
..
..
Somalia
**
**
Tanzania, United Republic of
1988
78
86
82
2002
76
81
78
2008
76
79
78
**
Uganda
1991
63
77
70
2002
76
86
81
2008
86
89
87
**
2002
Zambia
1990
66
67
66
66
78
69
2008
68
82
75
**
Zimbabwe
1992
94
97
95
..
..
..
2008
99
98
99
**
61
80
71
63
79
70
65
74
69
Middle Africa Angola
..
..
..
2001
63
84
72
2008
65
81
73
**
Cameroon
..
..
..
2000
78
88
83
2008
84
88
86
**
35
63
48
2000
49
73
61
2008
56
72
64
**
2004
31
54
42
2008
37
54
45
**
..
..
..
2005
78
87
80
Central African Republic
1988
Chad
1993
..
..
17
Congo
..
..
..
Congo, Democratic Republic of the
..
..
..
2001
63
78
70
2008
62
69
65
**
Equatorial Guinea
..
..
..
2000
97
98
97
2008
98
98
98
**
2008
96
98
97
**
2008
96
95
95
**
82
90
86
Gabon
1993
92
94
93
2004
96
98
97
Sao Tome and Principe
1991
92
96
94
2001
95
96
95
59
78
69
73
85
79
Northern Africa
**
Algeria
1987
62
86
74
2002
86
94
90
2006
89
94
92
Egypt
1986
54
71
63
1996
67
79
73
2006
82
88
85
Libyan Arab Jamahiriya
1994
96
99
98
2004
99
100 100
2008
100
100
100
**
Morocco
1994
46
71
58
2004
60
81
2008
68
85
77
** **
**
70
**
Sudan
..
..
..
2000
72
86
78
2008
82
89
85
Tunisia
..
..
..
2004
92
96
94
2008
96
98
97