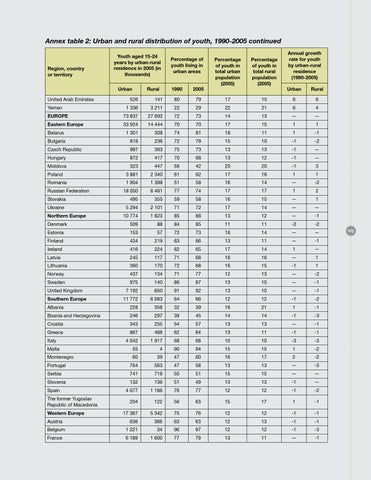
Annex table 2: Urban and rural distribution of youth, 1990-2005 continued
Region, country or territory
Youth aged 15-24 years by urban-rural residence in 2005 (in thousands) Urban
United Arab Emirates Yemen
Rural
526
141
Percentage of youth living in urban areas 1990
2005
80
79
Percentage of youth in total urban population (2005)
Percentage of youth in total rural population (2005)
17
15
Annual growth rate for youth by urban-rural residence (1990-2005) Urban
Rural
6
6
1 336
3 211
22
29
22
21
6
4
EUROPE
73 837
27 692
72
73
14
13
—
—
Eastern Europe
33 924
14 444
70
70
17
15
1
1
Belarus
1 301
308
74
81
18
11
1
-1
Bulgaria
818
236
72
78
15
10
-1
-2
Czech Republic
987
363
75
73
13
13
-1
—
Hungary
872
417
70
68
13
12
-1
—
Moldova Poland Romania Russian Federation Slovakia Ukraine Northern Europe
323
447
56
42
20
20
-1
3
3 881
2 340
61
62
17
16
1
1 -2
1 904
1 398
51
58
16
14
—
18 050
6 481
77
74
17
17
1
2
495
355
59
58
16
15
—
1
5 294
2 101
71
72
17
14
—
—
10 774
1 823
85
86
13
12
—
-1
Denmark
509
88
84
85
11
11
-2
-2
Estonia
153
57
72
73
16
14
—
—
Finland
434
219
63
66
13
11
—
-1
Ireland
416
224
62
65
17
14
1
—
Latvia
245
117
71
68
16
16
—
1
Lithuania
360
170
72
68
16
15
-1
1
Norway
437
134
71
77
12
13
—
-2
Sweden United Kingdom Southern Europe
975
140
86
87
13
10
—
-1
7 192
650
91
92
13
10
—
-1
11 772
6 083
64
66
12
12
-1
-2
Albania
228
358
32
39
16
21
1
-1
Bosnia and Herzegovina
246
297
39
45
14
14
-1
-3
Croatia
343
255
54
57
13
13
—
-1
Greece
867
488
62
64
13
11
-1
-1
4 042
1 917
68
68
10
10
-3
-3
55
4
90
94
15
15
1
-2
Italy Malta
60
39
47
60
16
17
2
-2
Portugal
Montenegro
764
563
47
58
13
13
—
-3
Serbia
741
718
50
51
15
15
—
—
Slovenia Spain The former Yugoslav Republic of Macedonia Western Europe Austria
132
136
51
49
13
13
-1
—
4 077
1 186
76
77
12
12
-1
-2
204
122
56
63
15
17
1
-1
17 367
5 342
75
76
12
12
-1
-1
636
366
63
63
12
13
-1
-1
Belgium
1 221
34
96
97
12
12
-1
-3
France
6 189
1 600
77
79
13
11
—
-1
105