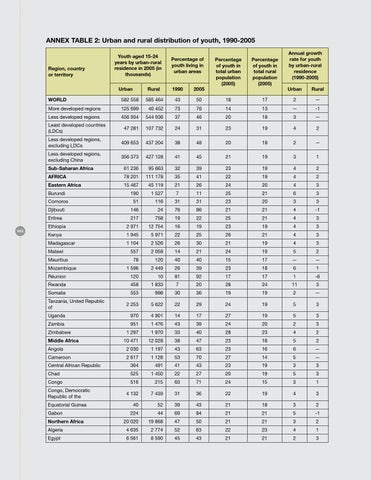
Annex table 2: Urban and rural distribution of youth, 1990-2005
Region, country or territory
Youth aged 15-24 years by urban-rural residence in 2005 (in thousands) Urban
WORLD
Rural
1990
2005
585 464
43
50
Percentage of youth in total urban population (2005)
Percentage of youth in total rural population (2005)
18
Annual growth rate for youth by urban-rural residence (1990-2005) Urban
Rural
17
2
—
More developed regions
125 699
40 452
73
76
14
13
—
-1
Less developed regions
456 934
544 936
37
46
20
18
3
—
47 281
107 732
24
31
23
19
4
2
Less developed regions, excluding LDCs
409 653
437 204
38
48
20
18
2
—
Less developed regions, excluding China
356 373
427 128
41
45
21
19
3
1
Least developed countries (LDCs)
Sub-Saharan Africa
61 236
95 663
32
39
23
19
4
2
AFRICA
78 201
111 178
35
41
22
19
4
2
Eastern Africa
15 467
45 119
21
26
24
20
4
3
190
1 527
7
11
25
21
6
3
51
116
31
31
23
20
3
3
Burundi Comoros
102
582 558
Percentage of youth living in urban areas
Djibouti
146
24
76
86
21
21
4
-1
Eritrea
217
758
19
22
25
21
4
3
Ethiopia
2 971
12 754
16
19
23
19
4
3
Kenya
1 945
5 971
22
25
26
21
4
3
Madagascar
1 104
2 526
26
30
21
19
4
3
557
2 058
14
21
24
19
5
2
78
120
40
40
15
17
—
—
1 596
2 449
26
39
23
18
6
1
120
10
81
92
17
17
1
-6
Rwanda
458
1 833
7
20
28
24
11
3
Somalia
553
998
30
36
19
19
2
—
2 253
5 622
22
29
24
19
5
3
970
4 901
14
17
27
19
5
3
Malawi Mauritius Mozambique Réunion
Tanzania, United Republic of Uganda Zambia Zimbabwe Middle Africa
951
1 476
43
39
24
20
2
3
1 297
1 970
33
40
28
23
4
2
10 471
12 028
38
47
23
18
5
2
Angola
2 030
1 197
43
63
23
16
6
—
Cameroon
—
2 617
1 128
53
70
27
14
5
Central African Republic
364
491
41
43
23
19
3
3
Chad
525
1 450
22
27
20
19
5
3
Congo
516
215
63
71
24
15
3
1
4 132
7 439
31
36
22
19
4
3
40
52
39
43
21
18
3
2
Congo, Democratic Republic of the Equatorial Guinea Gabon Northern Africa
224
44
69
84
21
21
5
-1
20 020
19 868
47
50
21
21
3
2
Algeria
4 635
2 774
52
63
22
23
4
1
Egypt
6 561
8 590
45
43
21
21
2
3