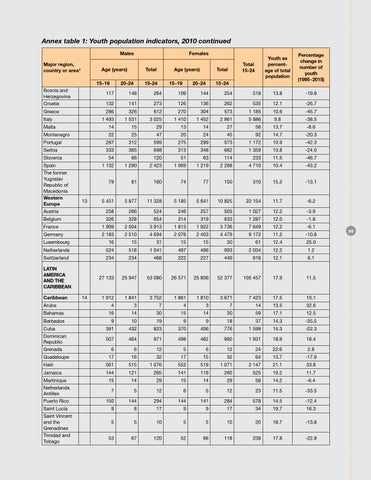
Annex table 1: Youth population indicators, 2010 continued Males Major region, country or area*
Females
Age (years) 15-19
Total
20-24
Age (years)
15-24
15-19
Total 15-24
Total
20-24
Youth as percentage of total population
Percentage change in number of youth (1995-2015)
13.8
-19.8
15-24
Bosnia and Herzegovina
117
148
264
109
144
254
Croatia
132
141
273
126
136
262
535
12.1
-26.7
Greece
286
326
612
270
304
573
1 185
10.6
-45.7
1 493
1 531
3 025
1 410
1 452
2 861
5 886
9.8
-38.5
Malta
14
15
29
13
14
27
56
13.7
-8.6
Montenegro
22
25
47
20
24
45
92
14.7
-20.3
Italy
518
Portugal
287
312
599
275
299
573
1 172
10.9
-42.3
Serbia
333
365
698
313
348
662
1 359
13.8
-24.0
54
66
120
51
63
114
233
11.5
-46.7
1 132
1 290
2 423
1 069
1 219
2 288
4 710
10.4
-43.2
79
81
160
74
77
150
310
15.2
-13.1
5 451
5 877
11 328
5 185
5 641
10 825
22 154
11.7
-6.2
258
266
524
246
257
503
1 027
12.2
-3.9 -1.8
Slovenia Spain The former Yugoslav Republic of Macedonia Western Europe
13
Austria
326
328
654
314
319
633
1 287
12.0
France
Belgium
1 909
2 004
3 913
1 813
1 922
3 736
7 649
12.2
-6.1
Germany
2 183
2 510
4 694
2 076
2 403
4 479
9 172
11.2
-10.8
Luxembourg
16
15
31
15
15
30
61
12.4
25.0
Netherlands
524
518
1 041
497
496
993
2 034
12.2
1.2
Switzerland
234
234
468
222
227
449
916
12.1
6.1
27 133
25 947
53 080
26 571
25 806
52 377
105 457
17.9
11.5
1 912
1 841
3 752
1 861
1 810
3 671
7 423
17.5
10.1
4
3
7
4
3
7
14
13.5
32.6
16
14
30
15
14
30
59
17.1
12.5
LATIN AMERICA AND THE CARIBBEAN Caribbean Aruba Bahamas Barbados
14
9
10
19
9
9
18
37
14.3
-35.5
Cuba
391
432
823
370
406
776
1 599
14.3
-22.3
Dominican Republic
507
464
971
498
462
960
1 931
18.9
18.4
6
6
12
5
6
12
24
22.6
2.8
Grenada Guadeloupe
17
16
32
17
15
32
64
13.7
-17.9
Haiti
561
515
1 076
552
519
1 071
2 147
21.1
33.8
Jamaica
144
121
265
141
119
260
525
19.2
11.7
15
14
29
15
14
29
58
14.2
-6.4
Netherlands Antilles
7
5
12
6
5
12
23
11.5
-33.5
Puerto Rico
150
144
294
144
141
284
578
14.5
-12.4
Saint Lucia
9
8
17
9
9
17
34
19.7
16.3
5
5
10
5
5
10
20
18.7
-13.8
53
67
120
52
66
118
239
17.8
-22.8
Martinique
Saint Vincent and the Grenadines Trinidad and Tobago
99