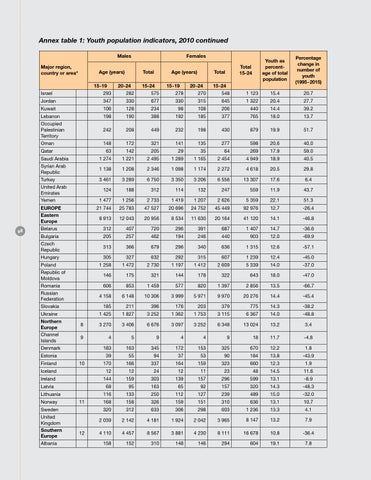
Annex table 1: Youth population indicators, 2010 continued Males Major region, country or area*
Age (years) 15-19
Total
20-24
Age (years)
15-24
15-19
Total 15-24
Total
20-24
Youth as percentage of total population
15-24
Percentage change in number of youth (1995-2015)
Israel
293
282
575
278
270
548
1 123
15.4
20.7
Jordan
347
330
677
330
315
645
1 322
20.4
27.7
Kuwait
106
128
234
98
108
206
440
14.4
39.2
Lebanon
198
190
388
192
185
377
765
18.0
13.7
Occupied Palestinian Territory
242
208
449
232
198
430
879
19.9
51.7
Oman
148
172
321
141
135
277
598
20.6
40.0
Qatar
63
142
205
29
35
64
269
17.9
59.0
Saudi Arabia
1 274
1 221
2 495
1 289
1 165
2 454
4 949
18.9
40.5
Syrian Arab Republic
1 138
1 208
2 346
1 098
1 174
2 272
4 618
20.5
29.8
Turkey
3 461
3 289
6 750
3 350
3 206
6 556
13 307
17.6
6.4
124
188
312
114
132
247
559
11.9
43.7
United Arab Emirates Yemen
98
Females
1 477
1 256
2 733
1 419
1 207
2 626
5 359
22.1
51.3
EUROPE
21 744
25 783
47 527
20 696
24 752
45 449
92 976
12.7
-26.4
Eastern Europe
8 913
12 043
20 956
8 534
11 630
20 164
41 120
14.1
-46.8
Belarus
312
407
720
296
391
687
1 407
14.7
-36.6
Bulgaria
205
257
462
194
246
440
903
12.0
-69.9
Czech Republic
313
366
679
296
340
636
1 315
12.6
-57.1
Hungary
305
327
632
292
315
607
1 239
12.4
-45.0
Poland
1 258
1 472
2 730
1 197
1 412
2 609
5 339
14.0
-37.0
Republic of Moldova
146
175
321
144
178
322
643
18.0
-47.0
Romania
606
853
1 459
577
820
1 397
2 856
13.5
-66.7
4 158
6 148
10 306
3 999
5 971
9 970
20 276
14.4
-45.4
Russian Federation Slovakia
185
211
396
176
203
379
775
14.3
-38.2
1 425
1 827
3 252
1 362
1 753
3 115
6 367
14.0
-48.8
8
3 270
3 406
6 676
3 097
3 252
6 348
13 024
13.2
3.4
9
4
5
9
4
4
9
18
11.7
-4.8
183
163
345
172
153
325
670
12.2
1.8
39
55
94
37
53
90
184
13.8
-43.9
Ukraine Northern Europe Channel Islands Denmark Estonia Finland
170
166
337
164
159
323
660
12.3
1.9
Iceland
10
12
12
24
12
11
23
48
14.5
11.6
Ireland
144
159
303
139
157
296
599
13.1
-8.9
Latvia
68
95
163
65
92
157
320
14.3
-48.3
116
133
250
112
127
239
489
15.0
-32.0
168
158
326
159
151
310
636
13.1
10.7
320
312
633
306
298
603
1 236
13.3
4.1
2 039
2 142
4 181
1 924
2 042
3 965
8 147
13.2
7.9
4 110
4 457
8 567
3 881
4 230
8 111
16 678
10.8
-36.4
158
152
310
148
146
294
604
19.1
7.8
Lithuania Norway
11
Sweden United Kingdom Southern Europe Albania
12