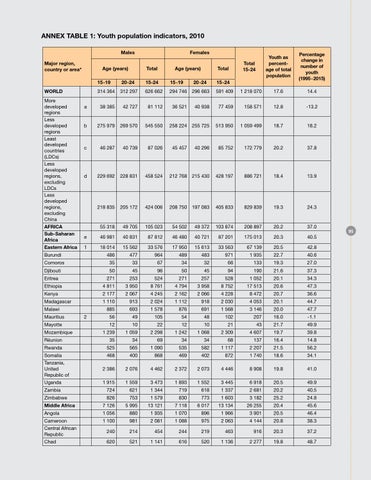
Annex table 1: Youth population indicators, 2010 Males Major region, country or area*
Age (years)
Total
Age (years)
Total
Youth as percentage of total population
Percentage change in number of youth (1995-2015)
20-24
15-24
15-19
314 364
312 297
626 662
294 746
296 663
591 409
1 218 070
17.6
14.4
a
38 385
42 727
81 112
36 521
40 938
77 459
158 571
12.8
-13.2
b
275 979
269 570
545 550
258 224
255 725
513 950
1 059 499
18.7
18.2
c
46 287
40 739
87 026
45 457
40 296
85 752
172 779
20.2
37.8
d
229 692
228 831
458 524
212 768
215 430
428 197
886 721
18.4
13.9
218 835
205 172
424 006
208 750
197 083
405 833
829 839
19.3
24.3
55 318
49 705
105 023
54 502
49 372
103 874
208 897
20.2
37.0
20.3
40.5
AFRICA
20-24
Total 15-24
15-19 WORLD More developed regions Less developed regions Least developed countries (LDCs) Less developed regions, excluding LDCs Less developed regions, excluding China
Females
15-24
Sub-Saharan Africa
e
46 981
40 831
87 812
46 480
40 721
87 201
175 013
Eastern Africa
1
18 014
15 562
33 576
17 950
15 613
33 563
67 139
20.5
42.8
486
477
964
489
483
971
1 935
22.7
40.6
Burundi Comoros
35
33
67
34
32
66
133
19.3
27.0
Djibouti
50
45
96
50
45
94
190
21.6
37.3
271
253
524
271
257
528
1 052
20.1
34.3
Ethiopia
Eritrea
4 811
3 950
8 761
4 794
3 958
8 752
17 513
20.6
47.3
Kenya
2 177
2 067
4 245
2 162
2 066
4 228
8 472
20.7
36.6
Madagascar
1 110
913
2 024
1 112
918
2 030
4 053
20.1
44.7
885
693
1 578
876
691
1 568
3 146
20.0
47.7
56
49
105
54
48
102
207
16.0
-1.1
12
10
22
12
10
21
43
21.7
49.9
1 239
1 059
2 298
1 242
1 068
2 309
4 607
19.7
39.8 14.8
Malawi Mauritius Mayotte Mozambique
2
RĂŠunion
35
34
69
34
34
68
137
16.4
Rwanda
525
565
1 090
535
582
1 117
2 207
21.5
56.2
Somalia
468
400
868
469
402
872
1 740
18.6
34.1
Tanzania, United Republic of
2 386
2 076
4 462
2 372
2 073
4 446
8 908
19.8
41.0
Uganda
1 915
1 559
3 473
1 893
1 552
3 445
6 918
20.5
49.9
Zambia
724
621
1 344
719
618
1 337
2 681
20.2
40.5
Zimbabwe
826
753
1 579
830
773
1 603
3 182
25.2
24.8
Middle Africa
7 126
5 995
13 121
7 118
6 017
13 134
26 255
20.4
45.6
Angola
1 056
880
1 935
1 070
896
1 966
3 901
20.5
46.4
Cameroon
1 100
981
2 081
1 088
975
2 063
4 144
20.8
38.3
Central African Republic
240
214
454
244
219
463
916
20.3
37.2
Chad
620
521
1 141
616
520
1 136
2 277
19.8
48.7
95