Figure I.3 Forestry 17%
Agriculture 14%
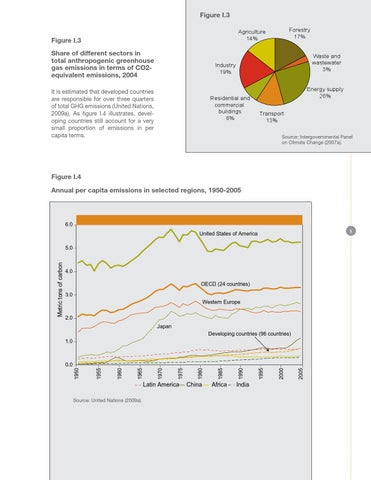
Figure I.3 Share of different sectors in total anthropogenic greenhouse gas emissions in terms of CO2equivalent emissions, 2004
Waste and wastewater 3%
Industry 19%
It is estimated that developed countries are responsible for over three quarters of total GHG emissions (United Nations, 2009a). As figure I.4 illustrates, developing countries still account for a very small proportion of emissions in per capita terms.
Residential and commercial buildings 8%
Energy supply 26% Transport 13% Source: Intergovernmental Panel on Climate Change (2007a).
Figure I.4 Annual per capita emissions in selected regions, 1950-2005 Figure I. Annual per capita emissions, selected regions, 1950-2005 6.0
5
United States of America
4.0 OECD (24 countries) 3.0 Western Europe 2.0 Japan Developing countries (96 countries) 1.0
Source: United Nations (2009a).
2005
India
2000
Africa
1995
1990
China
1985
Latin America
1980
1975
1970
1965
1960
1955
0.0 1950
Metric tons of carbon
5.0