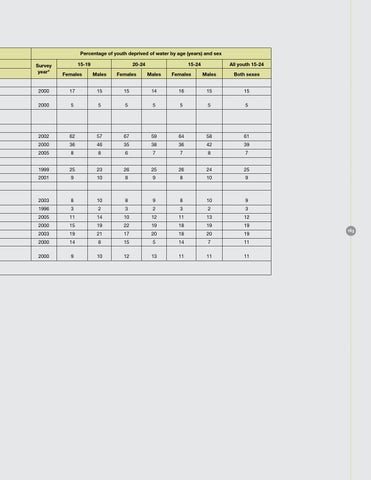
Percentage of youth deprived of water by age (years) and sex Survey year*
15-19
20-24
15-24
All youth 15-24
Females
Males
Females
Males
Females
Males
Both sexes
2000
17
15
15
14
16
15
15
2000
5
5
5
5
5
5
5
2002
62
57
67
59
64
58
61
2000
36
46
35
38
36
42
39
2005
8
8
6
7
7
8
7
1999
25
23
26
25
26
24
25
2001
9
10
8
9
8
10
9
2003
8
10
8
9
8
10
9
1996
3
2
3
2
3
2
3
2005
11
14
10
12
11
13
12
2000
15
19
22
19
18
19
19
2003
19
21
17
20
18
20
19
2000
14
8
15
5
14
7
11
2000
9
10
12
13
11
11
11
163