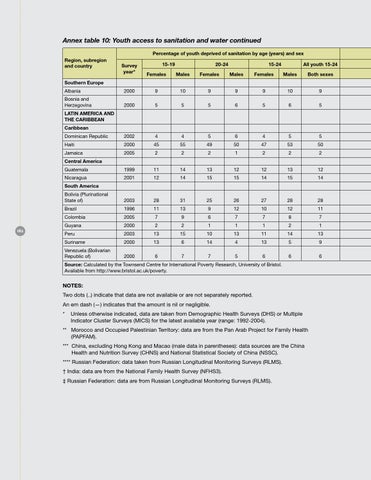
Annex table 10: Youth access to sanitation and water continued Percentage of youth deprived of sanitation by age (years) and sex Region, subregion and country
Survey year*
15-19
20-24
15-24
All youth 15-24
Females
Males
Females
Males
Females
Males
Both sexes
Southern Europe Albania
2000
9
10
9
9
9
10
9
Bosnia and Herzegovina
2000
5
5
5
6
5
6
5
Dominican Republic
2002
4
4
5
6
4
5
5
Haiti
2000
45
55
49
50
47
53
50
Jamaica
2005
2
2
2
1
2
2
2
Guatemala
1999
11
14
13
12
12
13
12
Nicaragua
2001
12
14
15
15
14
15
14
Bolivia (Plurinational State of)
2003
28
31
25
26
27
28
28
Brazil
1996
11
13
9
12
10
12
11
Colombia
2005
7
9
6
7
7
8
7
Guyana
2000
2
2
1
1
1
2
1
Peru
2003
13
15
10
13
11
14
13
Suriname
2000
13
6
14
4
13
5
9
Venezuela (Bolivarian Republic of)
2000
6
7
7
5
6
6
6
LATIN AMERICA AND THE CARIBBEAN Caribbean
Central America
South America
162
Source: Calculated by the Townsend Centre for International Poverty Research, University of Bristol. Available from http://www.bristol.ac.uk/poverty.
Notes: Two dots (..) indicate that data are not available or are not separately reported. An em dash (—) indicates that the amount is nil or negligible. * Unless otherwise indicated, data are taken from Demographic Health Surveys (DHS) or Multiple Indicator Cluster Surveys (MICS) for the latest available year (range: 1992-2004). ** Morocco and Occupied Palestinian Territory: data are from the Pan Arab Project for Family Health (PAPFAM). *** China, excluding Hong Kong and Macao (male data in parentheses): data sources are the China Health and Nutrition Survey (CHNS) and National Statistical Society of China (NSSC). **** Russian Federation: data taken from Russian Longitudinal Monitoring Surveys (RLMS). † India: data are from the National Family Health Survey (NFHS3). ‡ Russian Federation: data are from Russian Longitudinal Monitoring Surveys (RLMS).