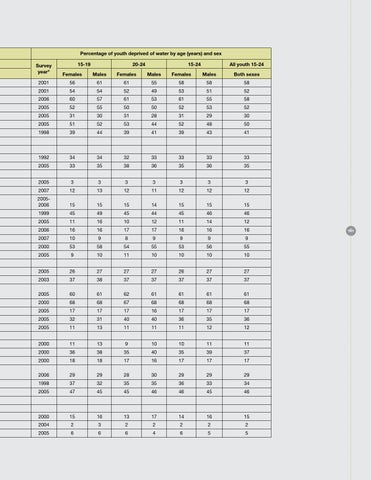
Percentage of youth deprived of water by age (years) and sex Survey year*
15-19
20-24
15-24
All youth 15-24
Females
Males
Females
Males
Females
Males
Both sexes
2001
56
61
61
55
58
58
58
2001
54
54
52
49
53
51
52
2006
60
57
61
53
61
55
58
2005
52
55
50
50
52
53
52
2005
31
30
31
28
31
29
30
2005
51
52
53
44
52
48
50
1998
39
44
39
41
39
43
41
1992
34
34
32
33
33
33
33
2005
33
35
38
36
35
36
35
2005
3
3
3
3
3
3
3
2007
12
13
12
11
12
12
12
20052006
15
15
15
14
15
15
15
1999
45
49
45
44
45
46
46
2005
11
16
10
12
11
14
12
2006
16
16
17
17
16
16
16
2007
10
9
8
9
9
9
9
2000
53
58
54
55
53
56
55
2005
9
10
11
10
10
10
10
2005
26
27
27
27
26
27
27
2003
37
38
37
37
37
37
37
2005
60
61
62
61
61
61
61
2000
68
68
67
68
68
68
68
2005
17
17
17
16
17
17
17
2005
32
31
40
40
36
35
36
2005
11
13
11
11
11
12
12
2000
11
13
9
10
10
11
11
2000
36
38
35
40
35
39
37
2000
18
18
17
16
17
17
17
2006
29
29
28
30
29
29
29
1998
37
32
35
35
36
33
34
2005
47
45
45
46
46
45
46
2000
15
16
13
17
14
16
15
2004
2
3
2
2
2
2
2
2005
6
6
6
4
6
5
5
161