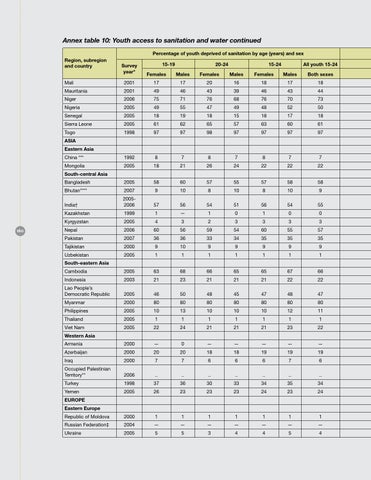
Annex table 10: Youth access to sanitation and water continued Percentage of youth deprived of sanitation by age (years) and sex Region, subregion and country
Survey year*
15-19
20-24
15-24
All youth 15-24
Females
Males
Females
Males
Females
Males
Both sexes
Mali
2001
17
17
20
16
18
17
18
Mauritania
2001
49
46
43
39
46
43
44
Niger
2006
75
71
76
68
76
70
73
Nigeria
2005
49
55
47
49
48
52
50
Senegal
2005
18
19
18
15
18
17
18
Sierra Leone
2005
61
62
65
57
63
60
61
Togo
1998
97
97
98
97
97
97
97
China ***
1992
8
7
8
7
8
7
7
Mongolia
2005
18
21
26
24
22
22
22
2005
58
60
57
55
57
58
58
Bhutan****
2007
9
10
8
10
8
10
9
India†
20052006
57
56
54
51
56
54
55
Kazakhstan
1999
1
—
1
0
1
0
0
Kyrgyzstan
2005
4
3
2
3
3
3
3
Nepal
2006
60
56
59
54
60
55
57
Pakistan
2007
36
36
33
34
35
35
35
Tajikistan
2000
9
10
9
9
9
9
9
Uzbekistan
2005
1
1
1
1
1
1
1
Cambodia
2005
63
68
66
65
65
67
66
Indonesia
2003
21
23
21
21
21
22
22
Lao People’s Democratic Republic
2005
46
50
48
45
47
48
47
Myanmar
2000
80
80
80
80
80
80
80
Philippines
2005
10
13
10
10
10
12
11
Thailand
2005
1
1
1
1
1
1
1
Viet Nam
2005
22
24
21
21
21
23
22
Armenia
2000
—
0
—
—
—
—
—
Azerbaijan
2000
20
20
18
18
19
19
19
Iraq
2000
7
7
6
6
6
7
6
Occupied Palestinian Territory**
2006
..
..
..
..
..
..
..
Turkey
1998
37
36
30
33
34
35
34
Yemen
2005
26
23
23
23
24
23
24
Republic of Moldova
2000
1
1
1
1
1
1
1
Russian Federation‡
2004
—
—
—
—
—
—
—
Ukraine
2005
5
5
3
4
4
5
4
ASIA Eastern Asia
South-central Asia Bangladesh
160
South-eastern Asia
Western Asia
EUROPE Eastern Europe