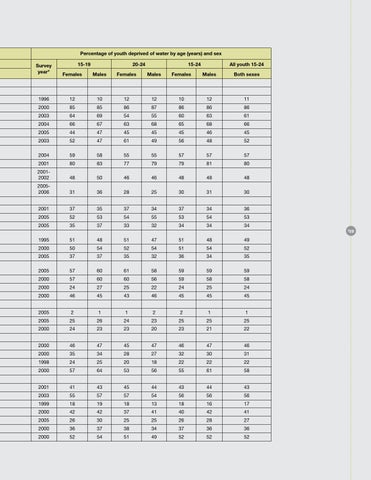
Percentage of youth deprived of water by age (years) and sex Survey year*
15-19
20-24
15-24
All youth 15-24
Females
Males
Females
Males
Females
Males
Both sexes
1996
12
10
12
12
10
12
11
2000
85
85
86
87
86
86
86
2003
64
69
54
55
60
63
61
2004
66
67
63
68
65
68
66
2005
44
47
45
45
45
46
45
2003
52
47
61
49
56
48
52
2004
59
58
55
55
57
57
57
2001
80
83
77
79
79
81
80
20012002
48
50
46
46
48
48
48
20052006
31
36
28
25
30
31
30
2001
37
35
37
34
37
34
36
2005
52
53
54
55
53
54
53
2005
35
37
33
32
34
34
34
1995
51
48
51
47
51
48
49
2000
50
54
52
54
51
54
52
2005
37
37
35
32
36
34
35
2005
57
60
61
58
59
59
59
2000
57
60
60
56
59
58
58
2000
24
27
25
22
24
25
24
2000
46
45
43
46
45
45
45
2005
2
1
1
2
2
1
1
2005
25
26
24
23
25
25
25
2000
24
23
23
20
23
21
22
2000
46
47
45
47
46
47
46
2000
35
34
28
27
32
30
31
1998
24
25
20
18
22
22
22
2000
57
64
53
56
55
61
58
2001
41
43
45
44
43
44
43
2003
55
57
57
54
56
56
56
1999
18
19
18
13
18
16
17
2000
42
42
37
41
40
42
41
2005
26
30
25
25
26
28
27
2000
36
37
38
34
37
36
36
2000
52
54
51
49
52
52
52
159