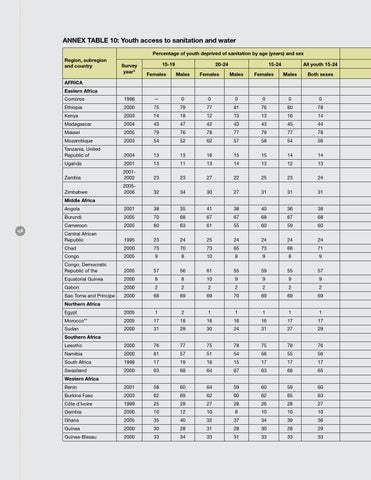
Annex table 10: Youth access to sanitation and water Percentage of youth deprived of sanitation by age (years) and sex Region, subregion and country
Survey year*
15-19
20-24
15-24
All youth 15-24
Females
Males
Females
Males
Females
Males
Both sexes
AFRICA Eastern Africa Comoros
1996
—
0
0
0
0
0
0
Ethiopia
2000
75
79
77
81
76
80
78
Kenya
2003
14
18
12
13
13
16
14
Madagascar
2004
43
47
42
43
43
45
44
Malawi
2005
79
76
78
77
79
77
78
Mozambique
2003
54
52
62
57
58
54
56
Tanzania, United Republic of
2004
13
13
16
15
15
14
14
Uganda
2001
13
11
13
14
13
12
13
Zambia
20012002
23
23
27
22
25
23
24
Zimbabwe
20052006
32
34
30
27
31
31
31
Angola
2001
38
35
41
38
40
36
38
Burundi
2005
70
68
67
67
68
67
68
Cameroon
2005
60
63
61
55
60
59
60
Central African Republic
1995
23
24
25
24
24
24
24
Chad
2000
73
70
73
65
73
68
71
Congo
2005
9
8
10
8
9
8
9
Congo, Democratic Republic of the
2005
57
56
61
55
59
55
57
Equatorial Guinea
2000
8
8
10
9
9
9
9
Gabon
2000
2
2
2
2
2
2
2
Sao Tome and Principe
2000
68
69
69
70
69
69
69
Egypt
2005
1
2
1
1
1
1
1
Morocco**
2005
17
18
16
16
16
17
17
Sudan
2000
31
29
30
24
31
27
29
Lesotho
2000
76
77
75
78
75
78
76
Namibia
2000
61
57
51
54
56
55
56
South Africa
1998
17
19
16
15
17
17
17
Swaziland
2000
63
68
64
67
63
68
65
Benin
2001
58
60
64
59
60
59
60
Burkina Faso
2003
62
69
62
60
62
65
63
Côte d’Ivoire
1999
25
29
27
28
26
28
27
Gambia
2000
10
12
10
8
10
10
10
Ghana
2005
35
40
32
37
34
39
36
Guinea
2000
30
28
31
28
30
28
29
Guinea-Bissau
2000
33
34
33
31
33
33
33
Middle Africa
158
Northern Africa
Southern Africa
Western Africa