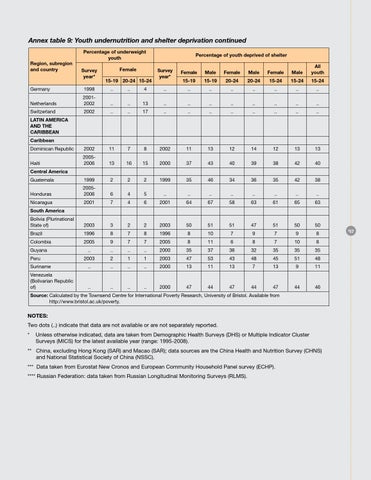
Annex table 9: Youth undernutrition and shelter deprivation continued Region, subregion and country
Percentage of underweight youth Survey year*
Female 15-19 20-24 15-24 ..
..
4
Percentage of youth deprived of shelter Survey year*
Female
Male
Female
Male
Female
Male
All youth
15-19
15-19
20-24
20-24
15-24
15-24
15-24
..
..
..
..
..
..
..
..
Germany
1998
Netherlands
20012002
..
..
13
..
..
..
..
..
..
..
..
Switzerland
2002
..
..
17
..
..
..
..
..
..
..
..
Dominican Republic
2002
11
7
8
2002
11
13
12
14
12
13
13
Haiti
20052006
13
16
15
2000
37
43
40
39
38
42
40
Guatemala
1999
2
2
2
1999
35
46
34
36
35
42
38
Honduras
20052006
6
4
5
..
..
..
..
..
..
..
..
Nicaragua
2001
7
4
6
2001
64
67
58
63
61
65
63
Bolivia (Plurinational State of)
2003
3
2
2
2003
50
51
51
47
51
50
50
Brazil
1996
8
7
8
1996
8
10
7
9
7
9
8
Colombia
2005
9
7
7
2005
8
11
6
8
7
10
8
..
..
..
..
2000
35
37
36
32
35
35
35
LATIN AMERICA AND THE CARIBBEAN Caribbean
Central America
South America
Guyana
2003
2
1
1
2003
47
53
43
48
45
51
48
Suriname
Peru
..
..
..
..
2000
13
11
13
7
13
9
11
Venezuela (Bolivarian Republic of)
..
..
..
..
2000
47
44
47
44
47
44
46
Source: Calculated by the Townsend Centre for International Poverty Research, University of Bristol. Available from http://www.bristol.ac.uk/poverty.
Notes: Two dots (..) indicate that data are not available or are not separately reported. * Unless otherwise indicated, data are taken from Demographic Health Surveys (DHS) or Multiple Indicator Cluster Surveys (MICS) for the latest available year (range: 1995-2008). ** China, excluding Hong Kong (SAR) and Macao (SAR); data sources are the China Health and Nutrition Survey (CHNS) and National Statistical Society of China (NSSC). *** Data taken from Eurostat New Cronos and European Community Household Panel survey (ECHP). **** Russian Federation: data taken from Russian Longitudinal Monitoring Surveys (RLMS).
157