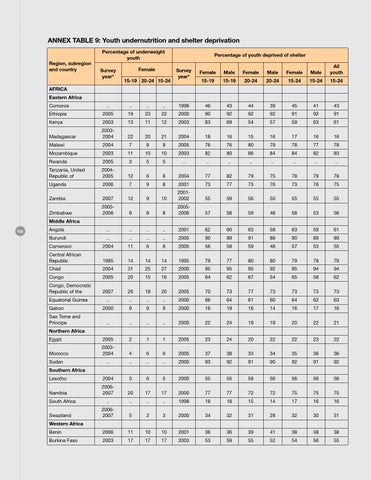
Annex table 9: Youth undernutrition and shelter deprivation Region, subregion and country
Percentage of underweight youth Survey year*
Female 15-19 20-24 15-24
Percentage of youth deprived of shelter Survey year*
Female
Male
Female
Male
Female
Male
All youth
15-19
15-19
20-24
20-24
15-24
15-24
15-24
AFRICA Eastern Africa Comoros
..
..
..
..
1996
46
43
44
39
45
41
43
Ethiopia
2005
19
23
22
2000
90
92
92
92
91
92
91
Kenya
2003
13
11
12
2003
63
69
54
57
59
63
61
Madagascar
20032004
22
20
21
2004
18
16
15
16
17
16
16
Malawi
2004
7
8
8
2005
76
76
80
79
78
77
78
Mozambique
2003
11
10
10
2003
82
80
86
84
84
82
83
5
5
..
..
..
..
..
..
..
..
Rwanda
2005
3
Tanzania, United Republic of
20042005
12
6
8
2004
77
82
79
75
78
79
78
Uganda
2006
7
9
8
2001
73
77
73
76
73
76
75
Zambia
2007
12
9
10
20012002
55
59
56
50
55
55
55
Zimbabwe
20052006
9
8
8
20052006
57
58
59
48
58
53
56
Middle Africa 154
Angola
..
..
..
..
2001
62
60
63
58
63
59
61
Burundi
..
..
..
..
2005
90
89
91
88
90
89
89
2004
11
6
8
2005
56
58
59
48
57
53
55
Cameroon Central African Republic
1995
14
14
14
1995
79
77
80
80
79
78
79
Chad
2004
31
25
27
2000
95
95
95
92
95
94
94
Congo
2005
20
15
16
2005
64
62
67
54
65
58
62
Congo, Democratic Republic of the
2007
26
18
20
2005
70
73
77
73
73
73
73
..
..
..
..
2000
66
64
61
60
64
62
63
2000
9
9
9
2000
16
19
16
14
16
17
16
..
..
..
..
2000
22
24
19
19
20
22
21
Egypt
2005
2
1
1
2005
23
24
20
22
22
23
22
Morocco
20032004
4
6
6
2005
37
38
33
34
35
36
36
..
..
..
..
2000
93
92
91
90
92
91
92
Lesotho
2004
3
6
5
2000
55
55
58
56
56
56
56
Namibia
20062007
20
17
17
2000
77
77
72
72
75
75
75
Equatorial Guinea Gabon Sao Tome and Principe Northern Africa
Sudan Southern Africa
South Africa
..
..
..
..
1998
18
18
15
14
17
16
16
20062007
5
2
3
2000
34
32
31
28
32
30
31
Benin
2006
11
10
10
2001
36
36
39
41
38
38
38
Burkina Faso
2003
17
17
17
2003
53
59
55
52
54
56
55
Swaziland Western Africa