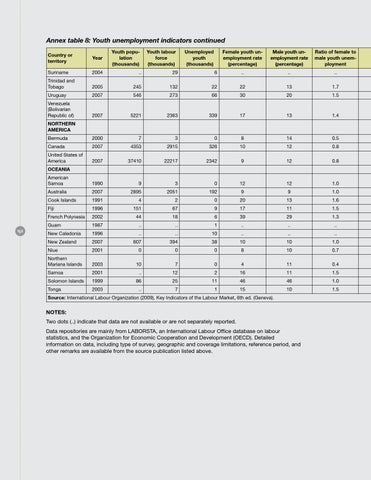
Annex table 8: Youth unemployment indicators continued Youth population (thousands)
Youth labour force (thousands)
Female youth unemployment rate (percentage)
Male youth unemployment rate (percentage)
Ratio of female to male youth unemployment
6
..
..
..
132
22
22
13
1.7
273
66
30
20
1.5
5221
2363
339
17
13
1.4
2000
7
3
0
8
14
0.5
Canada
2007
4353
2915
326
10
12
0.8
United States of America
2007
37410
22217
2342
9
12
0.8
Country or territory
Year
Suriname
2004
..
29
Trinidad and Tobago
2005
245
Uruguay
2007
546
Venezuela (Bolivarian Republic of)
2007
Bermuda
Unemployed youth (thousands)
NORTHERN AMERICA
OCEANIA
152
American Samoa
1990
9
3
0
12
12
1.0
Australia
2007
2895
2051
192
9
9
1.0
Cook Islands
1991
4
2
0
20
13
1.6
Fiji
1996
151
67
9
17
11
1.5
French Polynesia
2002
44
18
6
39
29
1.3
Guam
1987
..
..
1
..
..
..
New Caledonia
1996
..
..
10
..
..
..
New Zealand
2007
607
394
38
10
10
1.0
Niue
2001
0
0
0
8
10
0.7
Northern Mariana Islands
2003
10
7
0
4
11
0.4
Samoa
2001
..
12
2
16
11
1.5
Solomon Islands
1999
86
25
11
46
46
1.0
Tonga
2003
..
7
1
15
10
1.5
Source: International Labour Organization (2009), Key Indicators of the Labour Market, 6th ed. (Geneva).
Notes: Two dots (..) indicate that data are not available or are not separately reported. Data repositories are mainly from LABORSTA, an International Labour Office database on labour statistics, and the Organization for Economic Cooperation and Development (OECD). Detailed information on data, including type of survey, geographic and coverage limitations, reference period, and other remarks are available from the source publication listed above.