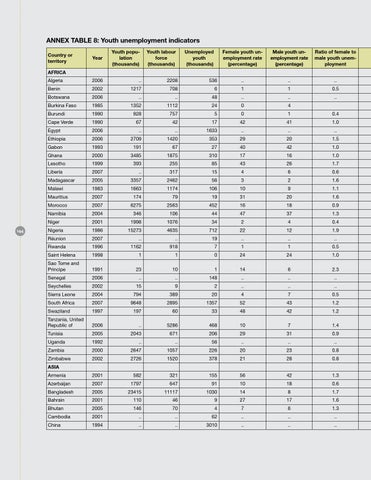
Annex table 8: Youth unemployment indicators Country or territory
Year
Youth population (thousands)
Youth labour force (thousands)
Unemployed youth (thousands)
Female youth unemployment rate (percentage)
Male youth unemployment rate (percentage)
Ratio of female to male youth unemployment
AFRICA
144
Algeria
2006
..
2208
536
..
..
..
Benin
2002
1217
708
6
1
1
0.5
Botswana
2006
..
..
48
..
..
..
Burkina Faso
1985
1352
1112
24
0
4
Burundi
1990
928
757
5
0
1
0.4
Cape Verde
1990
67
42
17
42
41
1.0
Egypt
2006
..
..
1633
..
..
..
Ethiopia
2006
2709
1420
353
29
20
1.5
Gabon
1993
191
67
27
40
42
1.0
Ghana
2000
3485
1875
310
17
16
1.0
Lesotho
1999
393
255
85
43
26
1.7
Liberia
2007
..
317
15
4
6
0.6
Madagascar
2005
3357
2462
56
3
2
1.6
Malawi
1983
1663
1174
106
10
9
1.1
Mauritius
2007
174
79
19
31
20
1.6
Morocco
2007
6275
2563
452
16
18
0.9
Namibia
2004
346
106
44
47
37
1.3
Niger
2001
1998
1076
34
2
4
0.4
Nigeria
1986
15273
4635
712
22
12
1.9
RĂŠunion
2007
..
..
19
..
..
..
Rwanda
1996
1162
918
7
1
1
0.5
Saint Helena
1998
1
1
0
24
24
1.0
Sao Tome and Principe
1991
23
10
1
14
6
2.3
Senegal
2006
..
..
148
..
..
..
Seychelles
2002
15
9
2
..
..
..
Sierra Leone
2004
794
389
20
4
7
0.5
South Africa
2007
9648
2895
1357
52
43
1.2
Swaziland
1997
197
60
33
48
42
1.2
Tanzania, United Republic of
2006
..
5286
468
10
7
1.4
Tunisia
2005
2043
671
206
29
31
0.9
Uganda
1992
..
..
56
..
..
..
Zambia
2000
2647
1057
226
20
23
0.8
Zimbabwe
2002
2726
1520
378
21
28
0.8
ASIA Armenia
2001
582
321
155
56
42
1.3
Azerbaijan
2007
1797
647
91
10
18
0.6
Bangladesh
2005
23415
11117
1030
14
8
1.7
Bahrain
2001
110
46
9
27
17
1.6
Bhutan
2005
146
70
4
7
6
1.3
Cambodia
2001
..
..
62
..
..
..
China
1994
..
..
3010
..
..
..