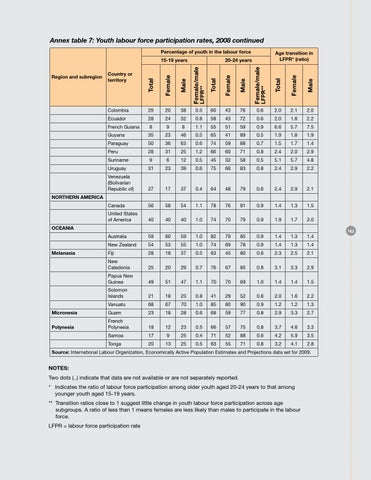
Annex table 7: Youth labour force participation rates, 2008 continued Percentage of youth in the labour force 15-19 years Region and subregion
Age transition in LFPR* (ratio)
20-24 years
Country or territory
Colombia
29
20
38
0.5
60
43
76
0.6
2.0
2.1
2.0
Ecuador
28
24
32
0.8
58
43
72
0.6
2.0
1.8
2.2
French Guiana
8
9
8
1.1
55
51
59
0.9
6.6
5.7
7.5
Guyana
35
23
46
0.5
65
41
89
0.5
1.9
1.8
1.9
Paraguay
50
36
63
0.6
74
59
88
0.7
1.5
1.7
1.4
Peru
28
31
25
1.2
66
60
71
0.8
2.4
2.0
2.9
Suriname
9
6
12
0.5
45
32
58
0.5
5.1
5.7
4.8
Uruguay
31
23
39
0.6
75
66
83
0.8
2.4
2.9
2.2
Venezuela (Bolivarian Republic of)
27
17
37
0.4
64
48
79
0.6
2.4
2.9
2.1
Canada
56
58
54
1.1
78
76
81
0.9
1.4
1.3
1.5
United States of America
40
40
40
1.0
74
70
79
0.9
1.9
1.7
2.0
Australia
59
60
59
1.0
82
79
85
0.9
1.4
1.3
1.4
New Zealand
54
53
55
1.0
74
69
78
0.9
1.4
1.3
1.4
Fiji
28
18
37
0.5
63
45
80
0.6
2.3
2.5
2.1
New Caledonia
25
20
29
0.7
76
67
85
0.8
3.1
3.3
2.9
Papua New Guinea
49
51
47
1.1
70
70
69
1.0
1.4
1.4
1.5
Solomon Islands
21
18
23
0.8
41
29
52
0.6
2.0
1.6
2.2
NORTHERN AMERICA
OCEANIA
Melanasia
Vanuatu
68
67
70
1.0
85
80
90
0.9
1.2
1.2
1.3
Micronesia
Guam
23
18
28
0.6
68
59
77
0.8
2.9
3.3
2.7
Polynesia
French Polynesia
18
12
23
0.5
66
57
75
0.8
3.7
4.6
3.3
Samoa
17
9
25
0.4
71
52
88
0.6
4.2
5.9
3.5
Tonga
20
13
25
0.5
63
55
71
0.8
3.2
4.1
2.8
Source: International Labour Organization, Economically Active Population Estimates and Projections data set for 2009.
Notes: Two dots (..) indicate that data are not available or are not separately reported. * Indicates the ratio of labour force participation among older youth aged 20-24 years to that among younger youth aged 15-19 years. ** T ransition ratios close to 1 suggest little change in youth labour force participation across age subgroups. A ratio of less than 1 means females are less likely than males to participate in the labour force. LFPR = labour force participation rate
143