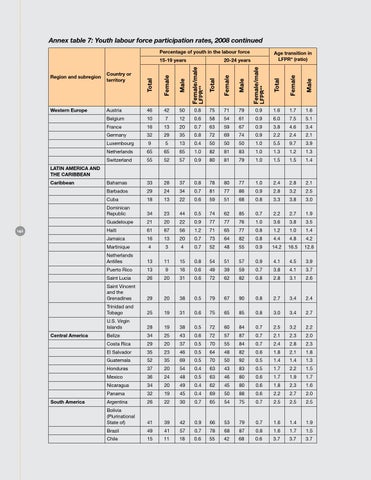
Annex table 7: Youth labour force participation rates, 2008 continued Percentage of youth in the labour force 15-19 years
Age transition in LFPR* (ratio)
20-24 years
Region and subregion
Country or territory
Western Europe
Austria
46
42
50
0.8
75
71
79
0.9
1.6
1.7
1.6
Belgium
10
7
12
0.6
58
54
61
0.9
6.0
7.5
5.1
France
16
13
20
0.7
63
59
67
0.9
3.8
4.6
3.4
Germany
32
29
35
0.8
72
69
74
0.9
2.2
2.4
2.1
Luxembourg
9
5
13
0.4
50
50
50
1.0
5.5
9.7
3.9
Netherlands
65
65
65
1.0
82
81
83
1.0
1.3
1.2
1.3
Switzerland
55
52
57
0.9
80
81
79
1.0
1.5
1.5
1.4
Bahamas
33
28
37
0.8
78
80
77
1.0
2.4
2.8
2.1
Barbados
29
24
34
0.7
81
77
86
0.9
2.8
3.2
2.5
Cuba
18
13
22
0.6
59
51
68
0.8
3.3
3.8
3.0
Dominican Republic
34
23
44
0.5
74
62
85
0.7
2.2
2.7
1.9
Guadeloupe
21
20
22
0.9
77
77
76
1.0
3.6
3.8
3.5
Haiti
61
67
56
1.2
71
65
77
0.8
1.2
1.0
1.4
Jamaica
16
13
20
0.7
73
64
82
0.8
4.4
4.8
4.2
Martinique
4
3
4
0.7
52
48
55
0.9
14.2
16.5
12.8
Netherlands Antilles
13
11
15
0.8
54
51
57
0.9
4.1
4.5
3.9
Puerto Rico
13
9
16
0.6
49
39
59
0.7
3.8
4.1
3.7
Saint Lucia
26
20
31
0.6
72
62
82
0.8
2.8
3.1
2.6
Saint Vincent and the Grenadines
29
20
38
0.5
79
67
90
0.8
2.7
3.4
2.4
Trinidad and Tobago
25
19
31
0.6
75
65
85
0.8
3.0
3.4
2.7
U.S. Virgin Islands
28
19
38
0.5
72
60
84
0.7
2.5
3.2
2.2
Belize
34
25
43
0.6
72
57
87
0.7
2.1
2.3
2.0
Costa Rica
29
20
37
0.5
70
55
84
0.7
2.4
2.8
2.3
El Salvador
35
23
46
0.5
64
48
82
0.6
1.8
2.1
1.8
Guatemala
52
35
69
0.5
70
50
92
0.5
1.4
1.4
1.3
Honduras
37
20
54
0.4
63
43
83
0.5
1.7
2.2
1.5
Mexico
36
24
48
0.5
63
46
80
0.6
1.7
1.9
1.7
Nicaragua
34
20
49
0.4
62
45
80
0.6
1.8
2.3
1.6
Panama
32
19
45
0.4
69
50
88
0.6
2.2
2.7
2.0
Argentina
26
22
30
0.7
65
54
75
0.7
2.5
2.5
2.5
Bolivia (Plurinational State of)
41
39
42
0.9
66
53
79
0.7
1.6
1.4
1.9
Brazil
49
41
57
0.7
78
68
87
0.8
1.6
1.7
1.5
Chile
15
11
18
0.6
55
42
68
0.6
3.7
3.7
3.7
LATIN AMERICA AND THE CARIBBEAN Caribbean
142
Central America
South America