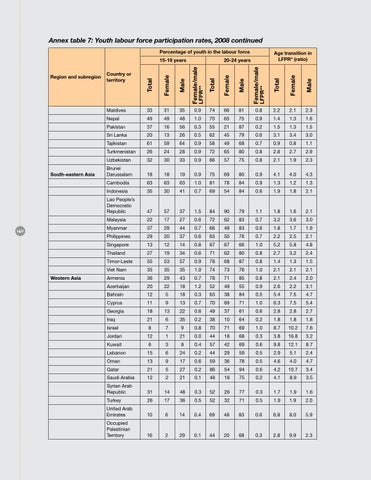
Annex table 7: Youth labour force participation rates, 2008 continued Percentage of youth in the labour force 15-19 years Region and subregion
South-eastern Asia
140
Western Asia
Age transition in LFPR* (ratio)
20-24 years
Country or territory
Maldives
33
31
35
0.9
74
66
81
0.8
2.2
2.1
2.3
Nepal
49
49
48
1.0
70
65
75
0.9
1.4
1.3
1.6
Pakistan
37
16
56
0.3
55
21
87
0.2
1.5
1.3
1.5
Sri Lanka
20
13
26
0.5
62
45
79
0.6
3.1
3.4
3.0
Tajikistan
61
59
64
0.9
58
49
68
0.7
0.9
0.8
1.1
Turkmenistan
26
24
28
0.9
72
65
80
0.8
2.8
2.7
2.9
Uzbekistan
32
30
33
0.9
66
57
75
0.8
2.1
1.9
2.3
Brunei Darussalam
18
18
19
0.9
75
69
80
0.9
4.1
4.0
4.3
Cambodia
63
63
63
1.0
81
78
84
0.9
1.3
1.2
1.3
Indonesia
35
30
41
0.7
69
54
84
0.6
1.9
1.8
2.1
Lao People’s Democratic Republic
47
57
37
1.5
84
90
79
1.1
1.8
1.6
2.1
Malaysia
22
17
27
0.6
72
62
83
0.7
3.2
3.6
3.0
Myanmar
37
29
44
0.7
66
49
83
0.6
1.8
1.7
1.9
Philippines
29
20
37
0.6
63
50
76
0.7
2.2
2.5
2.1
Singapore
13
12
14
0.8
67
67
66
1.0
5.2
5.8
4.8
Thailand
27
19
34
0.6
71
62
80
0.8
2.7
3.2
2.4
Timor-Leste
55
53
57
0.9
78
68
87
0.8
1.4
1.3
1.5
Viet Nam
35
35
35
1.0
74
73
76
1.0
2.1
2.1
2.1
Armenia
36
29
43
0.7
78
71
85
0.8
2.1
2.4
2.0
Azerbaijan
20
22
18
1.2
52
49
55
0.9
2.6
2.2
3.1
Bahrain
12
5
18
0.3
63
38
84
0.5
5.4
7.5
4.7
Cyprus
11
9
13
0.7
70
69
71
1.0
6.3
7.5
5.4
Georgia
18
13
22
0.6
49
37
61
0.6
2.8
2.8
2.7
Iraq
21
6
35
0.2
38
10
64
0.2
1.8
1.8
1.8
Israel
8
7
9
0.8
70
71
69
1.0
8.7
10.2
7.6
Jordan
12
1
21
0.0
44
18
68
0.3
3.8
16.8
3.2
Kuwait
6
3
8
0.4
57
42
69
0.6
9.8
12.1
8.7
Lebanon
15
6
24
0.2
44
29
59
0.5
2.9
5.1
2.4
Oman
13
9
17
0.6
59
36
78
0.5
4.6
4.0
4.7
Qatar
21
5
27
0.2
86
54
94
0.6
4.2
10.7
3.4
Saudi Arabia
12
2
21
0.1
48
18
75
0.2
4.1
8.9
3.5
Syrian Arab Republic
31
14
48
0.3
52
26
77
0.3
1.7
1.9
1.6
Turkey
26
17
36
0.5
52
32
71
0.5
1.9
1.9
2.0
United Arab Emirates
10
6
14
0.4
69
48
83
0.6
6.8
8.0
5.9
Occupied Palestinian Territory
16
2
29
0.1
44
20
68
0.3
2.8
9.9
2.3