30
Inequality matters
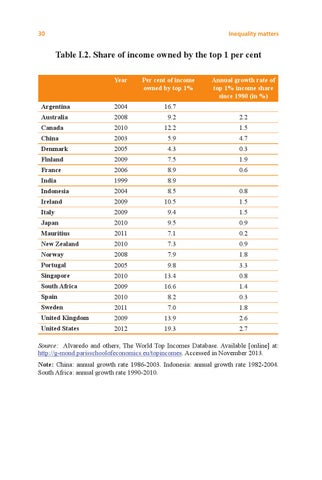
Table I.2. Share of income owned by the top 1 per cent Year
Per cent of income owned by top 1%
Annual growth rate of top 1% income share since 1980 (in %)
Argentina
2004
16.7
Australia
2008
9.2
2.2
Canada
2010
12.2
1.5
China
2003
5.9
4.7
Denmark
2005
4.3
0.3
Finland
2009
7.5
1.9
France
2006
8.9
0.6
India
1999
8.9
Indonesia
2004
8.5
0.8
Ireland
2009
10.5
1.5
Italy
2009
9.4
1.5
Japan
2010
9.5
0.9
Mauritius
2011
7.1
0.2
New Zealand
2010
7.3
0.9
Norway
2008
7.9
1.8
Portugal
2005
9.8
3.3
Singapore
2010
13.4
0.8
South Africa
2009
16.6
1.4
Spain
2010
8.2
0.3
Sweden
2011
7.0
1.8
United Kingdom
2009
13.9
2.6
United States
2012
19.3
2.7
Source: Alvaredo and others, The World Top Incomes Database. Available [online] at: http://g-mond.parisschoolofeconomics.eu/topincomes. Accessed in November 2013. Note: China: annual growth rate 1986-2003. Indonesia: annual growth rate 1982-2004. South Africa: annual growth rate 1990-2010.