18 4 2 12 10 0 10 3 31
13 4 8 1 19 6 13 3 35
Asia
14 3 11 2 20
8 2 6 6 44
51 11 40 14 130
65 22 17 26
Total
10.8 100.0
39.2
50.0
Percentage of countries
4.1 100.0
25.3
70.6
Percentage of total populationc
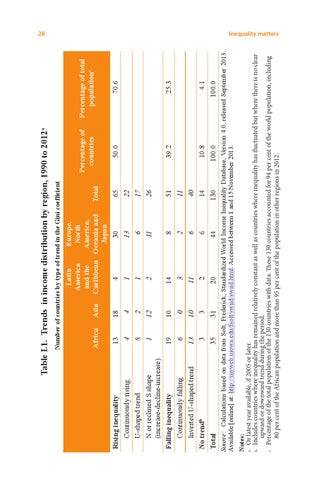
Notes: a. Or latest year available, if 2005 or later. b. Includes countries where inequality has remained relatively constant as well as countries where inequality has fluctuated but where there is no clear upward or downward trend during the period. c. Percentage of the total population of the 130 countries with data. These 130 countries accounted for 94 per cent of the world population, including 80 per cent of the African population and more than 95 per cent of the population in other regions in 2012.
Source: Calculations based on data from Solt, Frederick, Standardized World Income Inequality Database, Version 4.0, released September 2013. Available [online] at: http://myweb.uiowa.edu/fsolt/swiid/swiid.html. Accessed between 1 and 15 November 2013.
Continuously falling Inverted U-shaped trend No trendb Total
Continuously rising U-shaped trend N or reclined S shape (increase-decline-increase) Falling inequality
Rising inequality
Africa
Latin Europe, America North and the America, Caribbean Oceania and Japan 4 30 1 13 1 6 2 11
Number of countries by type of trend in the Gini coefficient
Table I.1. Trends in income distribution by region, 1990 to 2012a
28 Inequality matters