26
Inequality matters
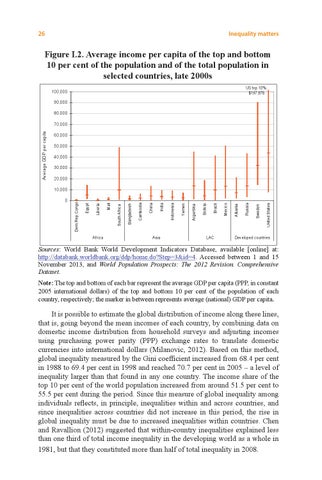
Figure I.2. Average income per capita of the top and bottom 10 per cent of the population and of the total population in selected countries, late 2000s US top 10%: $197,876
100,000 90,000
f
70,000
Average GDP per capita
80,000
60,000 50,000 40,000 30,000 20,000
Africa
Asia
LAC
United States
Russia
Sweden
Mexico
Albania
Brazil
Bolivia
Argentina
Yemen
Indonesia
India
China
Cambodia
Bangladesh
South Africa
Mali
Liberia
Egypt
0
Dem.Rep.Congo
10,000
Developed countries
Sources: World Bank World Development Indicators Database, available [online] at: http://databank.worldbank.org/ddp/home.do?Step=3&id=4. Accessed between 1 and 15 November 2013, and World Population Prospects: The 2012 Revision. Comprehensive Dataset. Note: The top and bottom of each bar represent the average GDP per capita (PPP, in constant 2005 international dollars) of the top and bottom 10 per cent of the population of each country, respectively; the marker in between represents average (national) GDP per capita.
It is possible to estimate the global distribution of income along these lines, that is, going beyond the mean incomes of each country, by combining data on domestic income distribution from household surveys and adjusting incomes using purchasing power parity (PPP) exchange rates to translate domestic currencies into international dollars (Milanovic, 2012). Based on this method, global inequality measured by the Gini coefficient increased from 68.4 per cent in 1988 to 69.4 per cent in 1998 and reached 70.7 per cent in 2005 – a level of inequality larger than that found in any one country. The income share of the top 10 per cent of the world population increased from around 51.5 per cent to 55.5 per cent during the period. Since this measure of global inequality among individuals reflects, in principle, inequalities within and across countries, and since inequalities across countries did not increase in this period, the rise in global inequality must be due to increased inequalities within countries. Chen and Ravallion (2012) suggested that within-country inequalities explained less than one third of total income inequality in the developing world as a whole in 1981, but that they constituted more than half of total inequality in 2008.