GDP ($ billion)
Population (millions)
ERF
CERF
Mortality rate, under 5 (per 1,000 births)
School enrollment, primary (% gross)
Adult literacy rate (% of population)
Life expectancy at birth
Socio-economic indicators
CERF and ERF funding ($ million)
Number of organizations in Response Plan
Amount Funded (US$ million)
Amount Requested (US$ million)
People Targeted (million)
Yemen humanitarian response plan
Measles – number of confirmed cases
Refugees residing in Yemen
Registered IDPs
Number of people without access to healthcare (millions) Number of people without access to safe water and basic sanitation (millions)
Food insecure (millions)
Number of people in need (millions)
Humanitarian needs
2010
2011
2012
60
96.9 96.7 62 92 64
66.4
63
31.99
23.8
8.5
23.5
66
325
586
6
2,177
237,182
385,320
12.7
5
10
63.3
63
29.21
23.3
3.7
14.8
29
194
290
5
2,676
214,270
347,295
7.2
63.9
63
31.74
22.7
0.2
14.5
25
121
187
2.5
510
190,092
220,994
7.3
12.7
2013
2011
2013
35.95
24.4
9.5
18.8
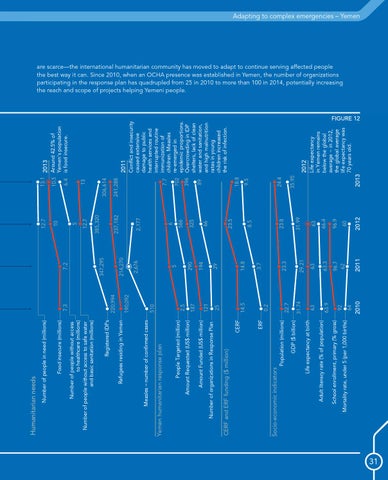
Life expectancy in Yemen remains below the global average − in 2012, the global average life expectancy was 70 years old.
2012
Conflict and insecurity caused extensive damage to public health services and interrupted routine 7.7 immunization of children. Measles 702 re-emerged in epidemic proportions. 396 Overcrowding in IDP shelters, lack of clean 89 water and sanitation, and high malnutrition rates in young children increased the risk of infection.
241,288
306,614
13
10.5 Around 42.5% of Yemen's population 6.4 is food insecure.
13.1
Adapting to complex emergencies – Yemen
are scarce—the international humanitarian community has moved to adapt to continue serving affected people the best way it can. Since 2010, when an OCHA presence was established in Yemen, the number of organizations participating in the response plan has quadrupled from 25 in 2010 to more than 100 in 2014, potentially increasing the reach and scope of projects helping Yemeni people.
FIGURE 12
31