Tables on drug cultivation, production and eradication and prevalence
xiii
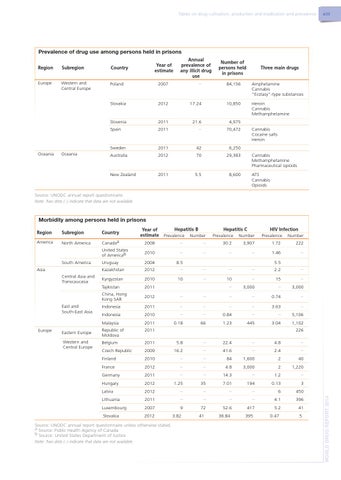
Prevalence of drug use among persons held in prisons Year of estimate
Annual prevalence of any illicit drug use
Number of persons held in prisons
Three main drugs
Region
Subregion
Country
Europe
Western and Central Europe
Poland
2007
∙∙
84,156
Amphetamine Cannabis "Ecstasy"-type substances
Slovakia
2012
17.24
10,850
Heroin Cannabis Methamphetamine
Slovenia
2011
21.6
4,975
Spain
2011
∙∙
70,472
Sweden
2011
42
6,250
Australia
2012
70
29,383
New Zealand
2011
5.5
8,600
Oceania
Oceania
Cannabis Cocaine salts Heroin Cannabis Methamphetamine Pharmaceutical opioids ATS Cannabis Opioids
Source: UNODC annual report questionnaire. Note: Two dots (∙∙) indicate that data are not available.
Morbidity among persons held in prisons Subregion
America
North America
Year of estimate
Hepatitis B Prevalence Number
Hepatitis C Prevalence Number
HIV Infection Prevalence Number
Canadaa
2008
∙∙
∙∙
30.2
3,907
1.72
222
United States of Americab
2010
∙∙
∙∙
∙∙
∙∙
1.46
∙∙
Uruguay
2004
8.5
Kazakhstan
2012
∙∙
∙∙
∙∙
∙∙
2.2
Kyrgyzstan
2010
10
∙∙
10
∙∙
15
∙∙
Tajikistan
2011
∙∙
3,000
∙∙
3,000
China, Hong Kong SAR
2012
∙∙
∙∙
∙∙
∙∙
0.74
∙∙
Indonesia
2011
∙∙
∙∙
∙∙
∙∙
3.63
∙∙
Indonesia
2010
∙∙
∙∙
0.84
∙∙
∙∙
5,106
Malaysia
2011
0.18
66
1.23
445
3.04
1,102
Eastern Europe
Republic of Moldova
2011
Western and Central Europe
Belgium
2011
5.8
∙∙
22.4
∙∙
4.8
∙∙
Czech Republic
2009
16.2
∙∙
41.6
∙∙
2.4
∙∙
Finland
2010
∙∙
∙∙
84
1,600
2
40
France
2012
∙∙
∙∙
4.8
3,000
2
1,220
Germany
2011
∙∙
∙∙
14.3
∙∙
1.2
∙∙
Hungary
2012
1.25
35
7.01
194
0.13
3
Latvia
2012
∙∙
∙∙
∙∙
∙∙
6
450
Lithuania
2011
∙∙
∙∙
∙∙
∙∙
4.1
396
5.2
41
South America Asia Central Asia and Transcaucasia
East and South-East Asia
Europe
Country
Luxembourg
2007
Slovakia
2012
Source: UNODC annual report questionnaire unless otherwise stated. a Source: Public Health Agency of Canada b Source: United States Department of Justice Note: Two dots (∙∙) indicate that data are not available.
5.5 ∙∙
226
9 3.82
72 41
52.6 36.84
417 395
0.47
5
WORLD DRUG REPORT 2014
Region