17,200
380
3,140
540
3,670
14,000
380
3,110
290
3,400
-
50
370
-
430
20,900
460
3,160
810
3,970
-
140
1,100
-
2,230
3,390
5,690
170
330
9,580
2,430
730
40
-
4,680
Upper
0.4
1.5
1.0
0.2
0.7
-
0.03
0.03
-
0.05
1.2
1.8
0.6
0.6
1.5
0.7
0.8
0.02
-
0.4
Best estimate
0.3
1.5
1.0
0.1
0.6
-
0.02
0.02
-
0.02
1.2
1.7
0.6
0.2
1.4
0.2
0.2
0.02
-
0.1
Lower
Prevalence (percentage)
0.4
1.9
1.0
0.4
0.7
-
0.05
0.07
-
0.08
1.3
1.8
0.6
1.2
1.5
1.1
0.9
0.03
-
0.8
Upper
34,400
510
1,950
850
2,800
-
440
8,980
-
19,520
1,410
4,410
340
210
6,370
-
610
740
-
5,200
Best estimate
13,900
WORLD DRUG REPORT 2014
410
1,920
470
2,400
-
370
3,440
-
4,530
1,170
3,710
340
20
5,250
-
300
260
-
1,360
Lower
Number (thousands)
54,800
530
1,980
1,230
3,220
-
820
20,400
-
34,520
1,640
5,100
340
520
7,600
-
830
1,220
-
8,950
Upper
0.7
2.1
0.6
0.4
0.5
-
0.2
0.6
-
0.7
0.5
1.4
1.3
0.8
1.0
-
0.7
0.6
-
0.9
0.3
1.7
0.6
0.2
0.4
-
0.1
0.2
-
0.2
0.4
1.2
1.3
0.1
0.8
-
0.4
0.2
-
0.2
Lower
Prevalence (percentage)
Best estimate
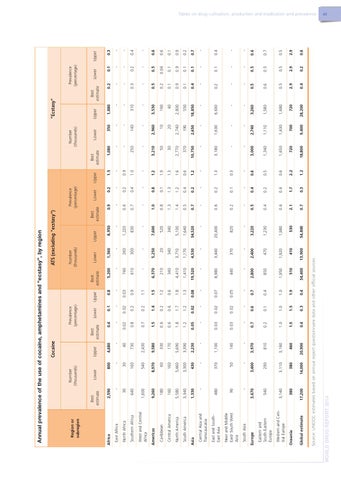
ATS (excluding "ecstasy")
Source: UNODC estimates based on annual report questionnaire data and other official sources.
Global estimate
Oceania
Western and Central Europe
Eastern and South-Eastern Europe
Europe
-
90
Near and Middle East/ South West Asia
South Asia
480
-
East and SouthEast Asia
Central Asia and Transcaucasia
1,330
5,460
5,580
3,340
North America
South America
Asia
60
160
180
160
Caribbean
Central America
3,300
8,970
540
160
9,260
1,600
West and Central Africa
Americas
640
Southern Africa
-
30
-
30
East Africa
North Africa
Lower
800
Best estimate
Number (thousands)
2,590
Africa
Region or subregion
Cocaine
Annual prevalence of the use of cocaine, amphetamines and “ecstasy�, by region
1.2
2.2
0.6
0.5
0.6
-
0.3
1.3
-
1.2
0.6
1.6
1.3
1.9
1.2
-
1.0
0.9
-
1.5
Upper
18,800
720
1,650
1,340
3,000
-
-
3,180
-
10,750
370
2,770
30
50
3,210
-
250
-
-
1,080
Best estimate
9,400
700
1,630
1,110
2,740
-
-
1,630
-
2,650
190
2,740
20
10
2,960
-
140
-
-
350
Lower
Number (thousands)
28,200
720
1,680
1,580
3,260
-
-
6,630
-
18,850
550
2,800
40
160
3,530
-
310
-
-
1,880
Upper
0.4
2.9
0.5
0.6
0.5
-
-
0.2
-
0.4
0.1
0.9
0.1
0.2
0.5
-
0.3
-
-
0.2
0.2
2.9
0.5
0.5
0.5
-
-
0.1
-
0.1
0.1
0.9
0.1
0.04
0.5
-
0.2
-
-
0.1
Lower
Prevalence (percentage)
Best estimate
"Ecstasy"
0.6
2.9
0.5
0.7
0.6
-
-
0.4
-
0.7
0.2
0.9
0.1
0.6
0.6
-
0.4
-
-
0.3
Upper
Tables on drug cultivation, production and eradication and prevalence xi