28,510
15,220
177,600
2,650
18,530
5,470
24,000
125,300
2,220
18,460
4,750
23,220
16,230
5,450
5,910
1,310
28,900
15,080
35,040
227,300
3,540
18,590
6,210
24,800
49,240
13,200
23,440
2,220
88,100
15,340
35,430
720
1,810
53,300
30,570
7,700
8,670
10,580
57,530
Upper
3.8
10.8
5.7
2.4
4.3
3.5
3.4
0.6
3.5
1.9
5.7
11.2
2.6
2.5
8.1
12.4
5.0
4.3
4.1
7.5
Best estimate
2.7
9.1
5.7
2.1
4.2
1.7
2.0
0.4
2.4
1.0
5.6
11.2
2.5
1.2
8.0
5.2
3.5
2.2
1.4
3.3
Lower
Prevalence (percentage)
4.9
14.5
5.7
2.7
4.5
5.2
4.8
1.5
4.1
3.1
5.7
11.3
2.7
6.6
8.4
13.3
9.1
6.6
7.1
9.7
Upper
33,000
740
1,210
2,800
4,010
2,890
5,190
3,370
470
11,920
830
13,460
40
100
14,440
1,020
340
320
250
1,930
Best estimate
28,600
560
1,140
2,790
3,930
2,170
3,880
2,530
460
9,040
800
13,320
40
60
14,210
440
230
130
90
900
Lower
Number (thousands)
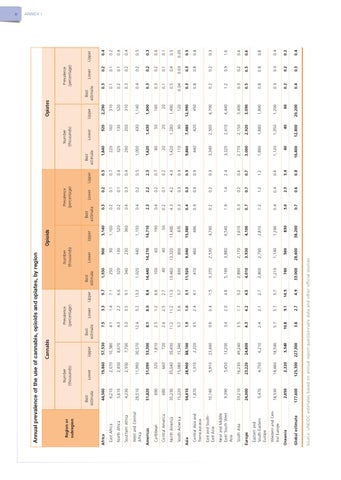
Source: UNODC estimates based on annual report questionnaire data and other official sources.
Global estimate
Oceania
Western and Central Europe
Eastern and South-Eastern Europe
Europe
33,210
9,390
Near and Middle East/ South West Asia
South Asia
10,140
1,870
East and SouthEast Asia
Central Asia and Transcaucasia
54,610
South America
Asia
35,230
North America
320
690
680
Caribbean
Central America
660
51,090
51,820
Americas
2,950
4,230
Southern Africa
West and Central Africa
11,990
2,850
5,610
North Africa
2,070
19,860
Lower
6,210
44,560
Best estimate
Number (thousands)
East Africa
Africa
Region or subregion
Cannabis
Annual prevalence of the use of cannabis, opioids and opiates, by region
38,200
830
1,290
2,810
4,100
3,610
6,540
4,740
490
15,380
870
13,600
50
190
14,710
1,150
360
520
1,100
3,140
Upper
Opioids
0.7
3.0
0.4
1.2
0.7
0.3
1.9
0.2
0.9
0.4
0.3
4.3
0.2
0.4
2.3
0.4
0.4
0.2
0.2
0.3
Best estimate
0.6
2.3
0.4
1.2
0.7
0.2
1.4
0.2
0.9
0.3
0.3
4.2
0.1
0.2
2.2
0.2
0.3
0.1
0.1
0.2
Lower
Prevalence (percentage)
0.8
3.4
0.4
1.2
0.7
0.4
2.4
0.3
0.9
0.5
0.3
4.3
0.2
0.7
2.3
0.5
0.4
0.4
0.7
0.5
Upper
16,400
40
1,120
1,890
3,000
2,770
3,320
3,340
440
9,860
110
1,420
20
80
1,620
1,000
290
320
220
1,840
Best estimate
12,800
40
1,050
1,880
2,920
2,150
2,410
2,500
420
7,480
90
1,280
20
50
1,430
430
200
130
160
920
Lower
Number (thousands)
20,200
60
1,200
1,890
3,090
3,400
4,440
4,700
450
12,990
120
1,490
20
160
1,800
1,140
310
520
310
2,290
Upper 0.3
0.4
0.2
0.3
0.8
0.5
0.3
1.2
0.2
0.8
0.3
0.04
0.5
0.1
0.3
0.3
0.4
0.3
0.2
0.1
0.3
0.2
0.3
0.8
0.5
0.2
0.9
0.2
0.8
0.3
0.03
0.4
0.1
0.2
0.2
0.2
0.2
0.1
0.1
0.2
Lower
Prevalence (percentage)
Best estimate
Opiates
0.4
0.2
0.4
0.8
0.6
0.4
1.6
0.3
0.8
0.5
0.05
0.5
0.1
0.6
0.3
0.5
0.4
0.4
0.2
0.4
Upper
x ANNEX I