2
12
49
Central Asia and Transcaucasian countries
East and South-East Asia
Near and Middle East/SouthWest Asia
1
Oceania
0.5
0.2
1.7
0.2
0.01
1.7
0.1
0.4
0.04
0.2
0.01
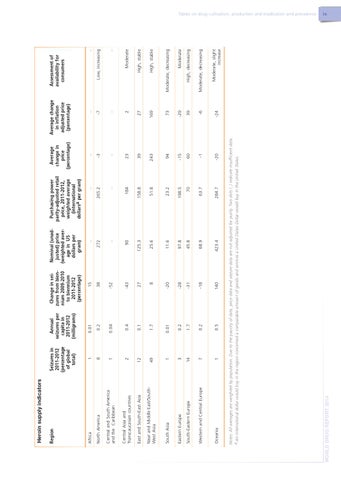
Annual seizures per capita in 2011-2012 (milligrams)
140
-18
-31
-28
-20
8
27
-43
-52
38
15
Change in seizures from biennium 2009-2010 to biennium 2011-2012 (percentage)
423.4
68.9
45.8
97.8
11.6
25.6
125.3
90
..
272
..
 Nominal (unadjusted) price (weighted average in US dollars per gram)
284.7
63.7
70
198.5
23.2
51.8
158.8
184
..
265.2
..
Purchasing power parity-adjusted retail price, 2011-2012, weighted average (international dollarsa per gram)
-20
-1
60
-15
94
243
39
23
..
-3
..
Average change in price (percentage)
WORLD DRUG REPORT 2014
Notes: All averages are weighted by population. Due to the paucity of data, price data and seizure data are not adjusted for purity. Two dots (..) indicate insufficient data. a An international dollar would buy in the region concerned a comparable amount of goods and services a United States Dollar would buy in the United States.
7
14
Western and Central Europe
South-Eastern Europe
3
1
Central and South America and the Caribbean
Eastern Europe
8
North America
1
1
Africa
South Asia
Seizures in 2011-2012 (percentage of global total)
Region
Heroin supply indicators
-24
-6
39
-29
73
169
27
2
..
-7
..
Average change in inflation adjusted price (percentage)
..
Moderate, slight increase
Moderate, decreasing
High, decreasing
Moderate
Moderate, decreasing
High, stable
High, stable
Moderate
..
Low, increasing
Assessment of availability for consumers
Tables on drug cultivation, production and eradication and prevalence ix