viii
ANNEX I
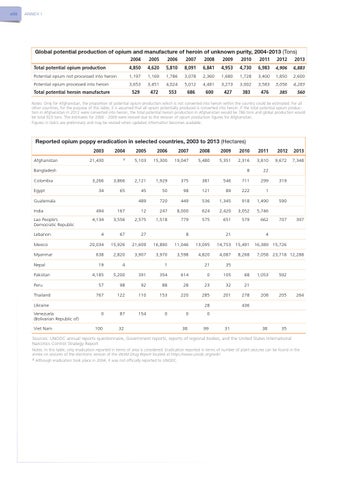
Global potential production of opium and manufacture of heroin of unknown purity, 2004-2013 (Tons) Total potential opium production
2004
2005
2006
2007
2008
2009
2010
2011
2012
2013
4,850
4,620
5,810
8,091
6,841
4,953
4,730
6,983
4,906
6,883
Potential opium not processed into heroin
1,197
1,169
1,786
3,078
2,360
1,680
1,728
3,400
1,850
2,600
Potential opium processed into heroin
3,653
3,451
4,024
5,012
4,481
3,273
3,002
3,583
3,056
4,283
Total potential heroin manufacture
529
472
553
686
600
427
383
476
385
560
Notes: Only for Afghanistan, the proportion of potential opium production which is not converted into heroin within the country could be estimated. For all other countries, for the purpose of this table, it is assumed that all opium potentially produced is converted into heroin. If the total potential opium production in Afghanistan in 2012 were converted into heroin, the total potential heroin production in Afghanistan would be 786 tons and global production would be total 923 tons. The estimates for 2006 - 2009 were revised due to the revision of opium production figures for Afghanistan. Figures in italics are preliminary and may be revised when updated information becomes available.
Reported opium poppy eradication in selected countries, 2003 to 2013 (Hectares) Afghanistan
2003
2004
2005
2006
2007
2008
2009
2010
2011
2012
2013
21,430
a
5,103
15,300
19,047
5,480
5,351
2,316
3,810
9,672
7,348
8
22
Bangladesh Colombia Egypt
3,266
3,866
2,121
1,929
375
381
546
711
299
34
65
45
50
98
121
89
222
1
489
720
449
536
1,345
918
1,490
Guatemala India Lao People’s Democratic Republic Lebanon Mexico Myanmar Nepal Pakistan Peru Thailand
494
167
12
247
8,000
624
2,420
3,052
5,746
4,134
3,556
2,575
1,518
779
575
651
579
662
4
67
27
20,034
15,926
21,609
16,890
11,046
13,095
638
2,820
3,907
3,970
3,598
4,820
4,087
19
4
21
35
4,185
5,200
391
354
614
0
105
68
57
98
92
88
28
23
32
21
767
122
110
153
220
285
201
278
8
1
Ukraine Venezuela (Bolivarian Republic of) Viet Nam
21
0
87
100
32
154
0
0
0
38
99
590
707
397
4
14,753 15,491
28
319
8,268
16,389 15,726 7,058 23,718 12,288
1,053
592
208
205
38
35
264
436
31
Sources: UNODC annual reports questionnaire, Government reports, reports of regional bodies, and the United States International Narcotics Control Strategy Report Notes: In this table, only eradication reported in terms of area is considered. Eradication reported in terms of number of plant seizures can be found in the annex on seizures of the electronic version of the World Drug Report located at https://www.unodc.org/wdr/ a Although eradication took place in 2004, it was not officially reported to UNODC.