0.11
South-Eastern Europe
0.26
46.4
137.4
5.6
1
0.3
244.4
959.6
2.9
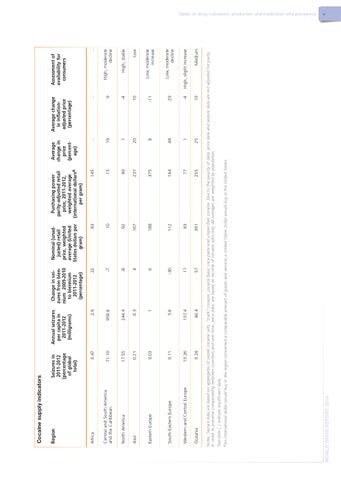
Annual seizures per capita in 2011-2012 (milligrams)
57
17
-30
6
4
-8
-7
22
Change in seizures from biennium 2009-2010 to biennium 2011-2012 (percentage)
391
83
112
188
167
92
10
83
Nominal (unadjusted) retail price, weighted average (United States dollars per gram)
255
77
164
375
237
90
15
145
Purchasing power parity-adjusted retail price, 2011-2012, weighted average (international dollarsa per gram)
25
1
48
8
20
1
19
..
Average change in price (percentage)
19
-4
29
-11
10
-4
9
..
Average change in inflationadjusted price (percentage)
..
Medium
High, slight increase
Low, moderate decline
Low, moderate increase
Low
High, stable
High, moderate decline
Assessment of availability for consumers
WORLD DRUG REPORT 2014
Two dots (..) indicate insufficient data. aAn international dollar would buy in the region concerned a comparable amount of goods and services a United States Dollar would buy in the United States.
Notes: Seizure data are based on aggregates of seized cocaine salts, “crack� cocaine, cocaine base, coca paste and unspecified cocaine. Due to the paucity of data, price data and seizure data are not adjusted for purity. In order to preserve comparability between countries and over time, price data are based on records of cocaine salts only. All averages are weighted by population.
Oceania
10.26
0.03
Eastern Europe
Western and Central Europe
0.21
17.55
North America
Asia
71.10
0.47
Seizures in 2011-2012 (percentage of global total)
Central and South America and the Caribbean
Africa
Region
Cocaine supply indicators
Tables on drug cultivation, production and eradication and prevalence v