iv
ANNEX I
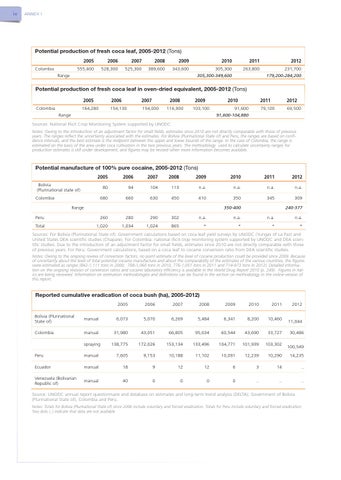
Potential production of fresh coca leaf, 2005-2012 (Tons) Colombia
2005
2006
2007
2008
2009
2010
2011
2012
555,400
528,300
525,300
389,600
343,600
305,300 305,300-349,600
263,800
231,700 179,200-284,200
Range
Potential production of fresh coca leaf in oven-dried equivalent, 2005-2012 (Tons) 2005 Colombia
164,280
2006
2007
154,130
154,000
2008
2009
2010
116,900
103,100
91,600 91,600-104,880
Range
2011
2012
79,100
69,500
Sources: National Illicit Crop Monitoring System supported by UNODC. Notes: Owing to the introduction of an adjustment factor for small fields, estimates since 2010 are not directly comparable with those of previous years. The ranges reflect the uncertainty associated with the estimates. For Bolivia (Plurinational State of) and Peru, the ranges are based on confidence intervals, and the best estimate is the midpoint between the upper and lower bounds of the range. In the case of Colombia, the range is estimated on the basis of the area under coca cultivation in the two previous years. The methodology used to calculate uncertainty ranges for production estimates is still under development, and figures may be revised when more information becomes available.
Potential manufacture of 100% pure cocaine, 2005-2012 (Tons) 2005
2006
2007
2008
2009
2010
2011
2012
80
94
104
113
n.a.
n.a.
n.a.
n.a.
680
660
630
450
410
350
345
309
Bolivia (Plurinational state of) Colombia
350-400
Range
240-377
Peru
260
280
290
302
n.a.
n.a.
n.a.
n.a.
Total
1,020
1,034
1,024
865
*
*
*
*
Sources: For Bolivia (Plurinational State of): Government calculations based on coca leaf yield surveys by UNODC (Yungas of La Paz) and United States DEA scientific studies (Chapare). For Colombia: national illicit crop monitoring system supported by UNODC and DEA scientific studies. Due to the introduction of an adjustment factor for small fields, estimates since 2010 are not directly comparable with those of previous years. For Peru: Government calculations, based on a coca leaf to cocaine conversion ratio from DEA scientific studies. Notes: Owing to the ongoing review of conversion factors, no point estimate of the level of cocaine production could be provided since 2009. Because of uncertainty about the level of total potential cocaine manufacture and about the comparability of the estimates of the various countries, the figures were estimated as ranges (842-1,111 tons in 2009, 788-1,060 tons in 2010, 776-1,051 tons in 2011 and 714-973 tons in 2012). Detailed information on the ongoing revision of conversion ratios and cocaine laboratory efficiency is available in the World Drug Report 2010 (p. 249). Figures in italics are being reviewed. Information on estimation methodologies and definitions can be found in the section on methodology in the online version of this report.
Reported cumulative eradication of coca bush (ha), 2005-2012) 2005
2006
2007
2008
2009
2010
2011
Bolivia (Plurinational State of)
manual
6,073
5,070
6,269
5,484
6,341
8,200
10,460
Colombia
manual
31,980
43,051
66,805
95,634
60,544
43,690
33,727
spraying
138,775
172,026
153,134
133,496
104,771
101,939
103,302
2012
11,044 30,486 100,549
Peru
manual
7,605
9,153
10,188
11,102
10,091
12,239
10,290
14,235
Ecuador
manual
18
9
12
12
6
3
14
..
Venezuela (Bolivarian Republic of)
manual
40
0
0
0
0
..
..
..
Source: UNODC annual report questionnaire and database on estimates and long-term trend analysis (DELTA); Government of Bolivia (Plurinational State of), Colombia and Peru. Notes: Totals for Bolivia (Plurinational State of) since 2006 include voluntary and forced eradication. Totals for Peru include voluntary and forced eradication. Two dots (..) indicate that data are not available