Tables on drug cultivation, production and eradication and prevalence
iii
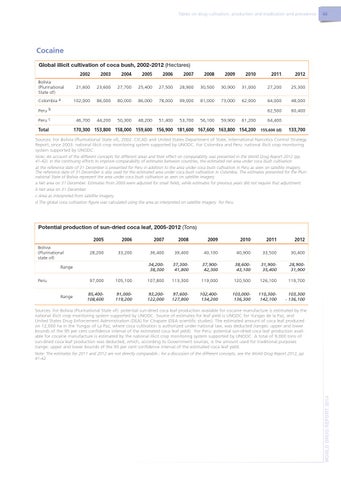
Cocaine Global illicit cultivation of coca bush, 2002-2012 (Hectares) Bolivia (Plurinational State of) Colombia a
2002
2003
2004
2005
2006
2007
2008
2009
2010
2011
2012
21,600
23,600
27,700
25,400
27,500
28,900
30,500
30,900
31,000
27,200
25,300
102,000
86,000
80,000
86,000
78,000
99,000
81,000
73,000
62,000
64,000
48,000
62,500
60,400
Peru b Peru c
46,700
Total
44,200
50,300
48,200
51,400
53,700
56,100
59,900
61,200
64,400
170,300 153,800 158,000 159,600 156,900 181,600 167,600 163,800 154,200
155,600 (d)
133,700
Sources: For Bolivia (Plurinational State of), 2002: CICAD and United States Department of State, International Narcotics Control Strategy Report; since 2003: national illicit crop monitoring system supported by UNODC. For Colombia and Peru: national illicit crop monitoring system supported by UNODC. Note: An account of the different concepts for different areas and their effect on comparability was presented in the World Drug Report 2012 (pp. 41-42). In the continuing efforts to improve comparability of estimates between countries, the estimated net area under coca bush cultivation at the reference date of 31 December is presented for Peru in addition to the area under coca bush cultivation in Peru as seen on satellite imagery. The reference date of 31 December is also used for the estimated area under coca bush cultivation in Colombia. The estimates presented for the Plurinational State of Bolivia represent the area under coca bush cultivation as seen on satellite imagery. a Net area on 31 December. Estimates from 2009 were adjusted for small fields, while estimates for previous years did not require that adjustment. b Net area on 31 December. c Area as interpreted from satellite imagery. d The global coca cultivation figure was calculated using the area as interpreted on satellite imagery for Peru.
Potential production of sun-dried coca leaf, 2005-2012 (Tons)
Bolivia (Plurinational state of)
2005
2006
2007
2008
2009
2010
2011
2012
28,200
33,200
36,400
39,400
40,100
40,900
33,500
30,400
34,20038,300
37,30041,800
37,90042,300
38,60043,100
31,90035,400
28,90031,900
Range Peru Range
97,000
105,100
107,800
113,300
119,000
120,500
126,100
119,700
85,400108,600
91,000119,200
93,200122,000
97,600127,800
102,400134,200
103,000136,300
110,300142,100
103,300 - 136,100
Sources: For Bolivia (Plurinational State of): potential sun-dried coca leaf production available for cocaine manufacture is estimated by the national illicit crop monitoring system supported by UNODC. Source of estimates for leaf yield is UNODC for Yungas de la Paz, and United States Drug Enforcement Administration (DEA) for Chapare (DEA scientific studies). The estimated amount of coca leaf produced on 12,000 ha in the Yungas of La Paz, where coca cultivation is authorized under national law, was deducted (ranges: upper and lower bounds of the 95 per cent confidence interval of the estimated coca leaf yield). For Peru: potential sun-dried coca leaf production available for cocaine manufacture is estimated by the national illicit crop monitoring system supported by UNODC. A total of 9,000 tons of sun-dried coca leaf production was deducted, which, according to Government sources, is the amount used for traditional purposes (range: upper and lower bounds of the 95 per cent confidence interval of the estimated coca leaf yield.
WORLD DRUG REPORT 2014
Note: The estimates for 2011 and 2012 are not directly comparable ; for a discussion of the different concepts, see the World Drug Report 2012, pp 41-42.