0.2
..
0.2
0.05
4.0
0.6
1.7
0.3
4.0
16.5
0.9
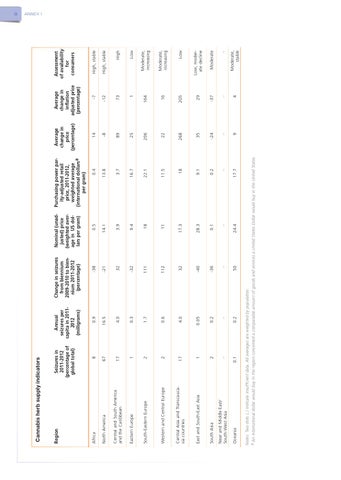
Annual seizures per capita in 20112012 (milligrams)
50
..
-36
-40
32
112
111
-32
32
-21
-38
Change in seizures from biennium 2009-2010 to biennium 2011-2012 (percentage)
24.4
..
0.1
28.3
17.3
11
18
9.4
3.9
14.1
0.5
 Nominal (unadjusted) price (weighted average in US dollars per gram)
17.7
..
0.2
9.1
18
11.5
22.1
16.7
3.7
13.8
0.4
Purchasing power parity-adjusted retail price, 2011-2012, weighted average (international dollarsa per gram)
Notes: Two dots (..) indicate insufficient data. All averages are weighted by population. a An international dollar would buy in the region concerned a comparable amount of goods and services a United States Dollar would buy in the United States.
0.1
..
Near and Middle East/ South-West Asia
Oceania
2
17
Central Asia and Transcaucasia countries
South Asia
2
Western and Central Europe
1
2
South-Eastern Europe
East and South-East Asia
1
17
Central and South America and the Caribbean
Eastern Europe
67
8
Seizures in 2011-2012 (percentage of global total)
North America
Africa
Region
Cannabis herb supply indicators
9
..
-24
35
268
22
206
25
89
-8
14
Average change in price (percentage)
4
..
-37
29
205
16
164
1
73
-12
-7
Average change in inflation adjusted price (percentage)
Moderate, stable
..
Moderate
Low, moderate decline
Low
Moderate, increasing
Moderate, increasing
Low
High
High, stable
High, stable
Assessment of availability for consumers
ii ANNEX I