1. RECENT STATISTICS AND TREND ANALYSIS OF THE ILLICIT DRUG MARKET
25
4
20
3
15
2
10
2013
2011
2009
2007
2005
2003
2001
1999
0 1997
0 1995
5 1993
1
Interception ratea Total opiate seizures in opium equivalents (indexed, left axis) Opium cultivation (indexed, left axis) Opium production (indexed, left axis) a The practical significance of the “interception rate” should be approached with caution, as this concept is ultimately an abstract ratio which, depending on the context, may not always be intuitive (see footnote 90).
Source: UNODC estimates based on annual report questionnaire and national illicit crop monitoring systems supported by UNODC, supplemented by other official data.
Fig. 19. Comparison of growth rates in supply of and demand for illicit opiates, 1998-2012 2.0 1.8 1.6 1.4 1.2 1.0 0.8 1998 1999 2000 2001 2002 2003 2004 2005 2006 2007 2008 2009 2010 2011 2012
0.6
Available supply of opiates, range (indexed) Opium production, 2 year moving average (indexed relative to line of best fit) Number of opiate users (UNODC estimates) (indexed relative to line of best fit) Opium production (line of best fit, baseline 1998) Available opium supply (line of best fit, baseline 1998) Number of opiate users (line of best fit, baseline 1998)
Source: UNODC estimates based on annual report questionnaire and national illicit crop monitoring systems supported by UNODC, supplemented by other official data.
1.2
1.8 1.6
1.0
1.4
0.8
1.2 1.0
0.6
0.8
0.4
0.6 0.4
0.2
0.2
0.0
0.0
Prevalence of past-year use (Percentage)
30
1998 1999 2000 2001 2002 2003 2004 2005 2006 2007 2008 2009 2010 2011 2012
5
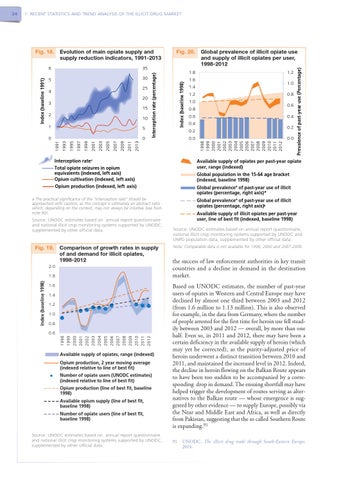
Global prevalence of illicit opiate use Fig. and 20. supply Globalof prevalence of illicit opiate use illicit opiates per user, and supply of illicit opiates per user, 1998-2012 1998-2012
Index (baseline 1998)
35 Interception rate (percentage)
6
1991
Index (baseline 1991)
Evolution of main opiate supply and supply reduction indicators, 1991 2013 Fig. 18. Evolution of main opiate supply and supply reduction indicators, 1991-2013
Index (baseline 1998)
24
Available supply of opiates per past-year opiate user, range (indexed) Global population in the 15-64 age bracket (indexed, baseline 1998) Global prevalenceª of past-year use of illicit opiates (percentage, right axis)* Global prevalenceª of past-year use of illicit opiates (percentage, right axis)ᵇ Available supply of illicit opiates per past-year user, line of best fit (indexed, baseline 1998) Source: UNODC estimates based on annual report questionnaire, national illicit crop monitoring systems supported by UNODC and UNPD population data, supplemented by other official data. Note: Comparable data is not available for 1999, 2000 and 2007-2009.
the success of law enforcement authorities in key transit countries and a decline in demand in the destination market. Based on UNODC estimates, the number of past-year users of opiates in Western and Central Europe may have declined by almost one third between 2003 and 2012 (from 1.6 million to 1.13 million). This is also observed for example, in the data from Germany, where the number of people arrested for the first time for heroin use fell steadily between 2003 and 2012 — overall, by more than one half. Even so, in 2011 and 2012, there may have been a certain deficiency in the available supply of heroin (which may yet be corrected), as the purity-adjusted price of heroin underwent a distinct transition between 2010 and 2011, and maintained the increased level in 2012. Indeed, the decline in heroin flowing on the Balkan Route appears to have been too sudden to be accompanied by a corresponding drop in demand. The ensuing shortfall may have helped trigger the development of routes serving as alternatives to the Balkan route — whose emergence is suggested by other evidence — to supply Europe, possibly via the Near and Middle East and Africa, as well as directly from Pakistan, suggesting that the so called Southern Route is expanding.91 91 UNODC, The illicit drug trade through South-Eastern Europe, 2014.