1. RECENT STATISTICS AND TREND ANALYSIS OF THE ILLICIT DRUG MARKET
High levels of use of other substances were also reported, with annual prevalence as follows: cannabis, 2.6 per cent; amphetamine, 1 per cent; methamphetamine, 1.6 per cent; “ecstasy”, 1.7 per cent; cocaine, 1.6 per cent; and crack, 2 per cent. The prevalence in the last year of people injecting drugs was reported as 1.9 per cent.43 In South Africa, expert perception is that there is some increase in the use of heroin and methamphetamine and some decrease in the use of crack cocaine (with use of other drugs being stable).44 Treatment facilities report that cannabis remains the most common illicit substance used, particularly among young people. Almost half of the admissions at specialist treatment centres were primarily related to cannabis use disorders. Polydrug use appears to be a common phenomenon among drug users in treatment.45
Americas With the exception of opiate use, use of all other groups of substances (cannabis, opioids, cocaine, ATS and “ecstasy”) remains at levels higher than the global average in the region. North America
In the United States, past-year illicit drug use by persons aged 12 years or older reached the highest level in the past
42 43 44 45
among the general population, conducted by the Ministry of Justice of Cabo Verde, published in April 2013, in collaboration with UNODC. UNODC, annual report questionnaire replies submitted by Nigeria for 2012. Federal Neuropsychiatric Hospital, Aro, Substance Abuse in Perspective in Nigeria 2009: National Survey on Alcohol and Drug Use in Nigeria 2012, Nigeria. UNODC, annual report questionnaire replies submitted by South Africa for 2012. Siphokazi Dada and others, “Alcohol and drug abuse trends”, update, June 2013 (Cape Town, South Africa, South African Community Epidemiology Network on Drug Use, 2013).
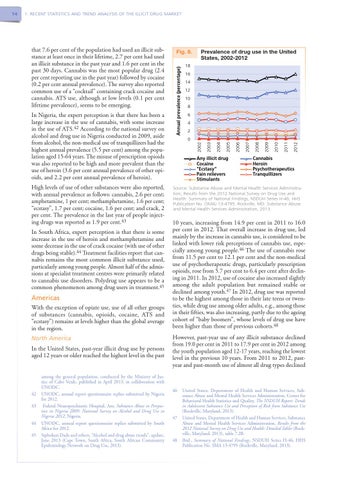
Prevalence of drug use in the United States, 2002-2012
18 16 14 12 10 8 6 4 2
Any illicit drug Cocaine "Ecstasy" Pain relievers Stimulants
2012
2011
2010
2009
2008
2007
2006
2005
2004
0 2003
In Nigeria, the expert perception is that there has been a large increase in the use of cannabis, with some increase in the use of ATS.42 According to the national survey on alcohol and drug use in Nigeria conducted in 2009, aside from alcohol, the non-medical use of tranquillizers had the highest annual prevalence (5.5 per cent) among the population aged 15-64 years. The misuse of prescription opioids was also reported to be high and more prevalent than the use of heroin (3.6 per cent annual prevalence of other opioids, and 2.2 per cent annual prevalence of heroin).
Fig. 8.
2002
that 7.6 per cent of the population had used an illicit substance at least once in their lifetime, 2.7 per cent had used an illicit substance in the past year and 1.6 per cent in the past 30 days. Cannabis was the most popular drug (2.4 per cent reporting use in the past year) followed by cocaine (0.2 per cent annual prevalence). The survey also reported common use of a “cocktail” containing crack cocaine and cannabis. ATS use, although at low levels (0.1 per cent lifetime prevalence), seems to be emerging.
Annual prevalence (percentage)
14
Cannabis Heroin Psychotherapeutics Tranquillizers
Source: Substance Abuse and Mental Health Services Administration, Results from the 2012 National Survey on Drug Use and Health: Summary of National Findings, NSDUH Series H-46, HHS Publication No. (SMA) 13-4795. Rockville, MD: Substance Abuse and Mental Health Services Administration, 2013.
10 years, increasing from 14.9 per cent in 2011 to 16.0 per cent in 2012. That overall increase in drug use, led mainly by the increase in cannabis use, is considered to be linked with lower risk perceptions of cannabis use, especially among young people.46 The use of cannabis rose from 11.5 per cent to 12.1 per cent and the non-medical use of psychotherapeutic drugs, particularly prescription opioids, rose from 5.7 per cent to 6.4 per cent after declining in 2011. In 2012, use of cocaine also increased slightly among the adult population but remained stable or declined among youth.47 In 2012, drug use was reported to be the highest among those in their late teens or twenties, while drug use among older adults, e.g., among those in their fifties, was also increasing, partly due to the ageing cohort of “baby boomers”, whose levels of drug use have been higher than those of previous cohorts.48 However, past-year use of any illicit substance declined from 19.0 per cent in 2011 to 17.9 per cent in 2012 among the youth population aged 12-17 years, reaching the lowest level in the previous 10 years. From 2011 to 2012, pastyear and past-month use of almost all drug types declined
46 United States, Department of Health and Human Services, Substance Abuse and Mental Health Services Administration, Center for Behavioral Health Statistics and Quality, The NSDUH Report: Trends in Adolescent Substance Use and Perception of Risk from Substance Use (Rockville, Maryland, 2013). 47 United States, Department of Health and Human Services, Substance Abuse and Mental Health Services Administration, Results from the 2012 National Survey on Drug Use and Health: Detailed Tables (Rockville, Maryland, 2013), table 7.2B. 48 Ibid., Summary of National Findings, NSDUH Series H-46, HHS Publication No. SMA 13-4795 (Rockville, Maryland, 2013).