B. Health and social impact
Table 4.
7
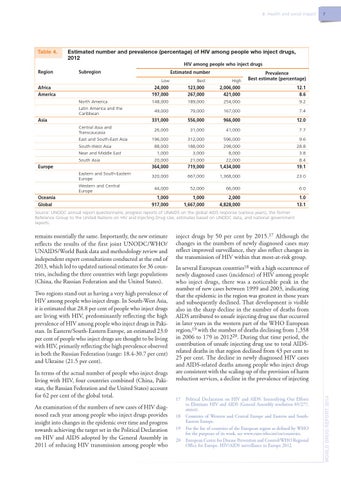
Estimated number and prevalence (percentage) of HIV among people who inject drugs, 2012 HIV among people who inject drugs
Region
Subregion
Africa America North America Latin America and the Caribbean Asia Central Asia and Transcaucasia East and South-East Asia South-West Asia Near and Middle East South Asia Europe Eastern and South-Eastern Europe Western and Central Europe Oceania Global
Estimated number Low
Best
High
Prevalence Best estimate (percentage)
24,000 197,000 148,000
123,000 267,000 189,000
2,006,000 421,000 254,000
12.1 8.6 9.2
49,000
79,000
167,000
7.4
331,000
556,000
966,000
12.0
26,000
31,000
41,000
7.7
196,000 88,000 1,000 20,000 364,000
312,000 188,000 3,000 21,000 719,000
596,000 298,000 8,000 22,000 1,434,000
9.6 28.8 3.8 8.4 19.1
320,000
667,000
1,368,000
23.0
44,000
52,000
66,000
6.0
1,000 917,000
1,000 1,667,000
2,000 4,828,000
1.0 13.1
Source: UNODC annual report questionnaire; progress reports of UNAIDS on the global AIDS response (various years), the former Reference Group to the United Nations on HIV and Injecting Drug Use, estimates based on UNODC data, and national government reports.
Two regions stand out as having a very high prevalence of HIV among people who inject drugs. In South-West Asia, it is estimated that 28.8 per cent of people who inject drugs are living with HIV, predominantly reflecting the high prevalence of HIV among people who inject drugs in Pakistan. In Eastern/South-Eastern Europe, an estimated 23.0 per cent of people who inject drugs are thought to be living with HIV, primarily reflecting the high prevalence observed in both the Russian Federation (range: 18.4-30.7 per cent) and Ukraine (21.5 per cent). In terms of the actual number of people who inject drugs living with HIV, four countries combined (China, Pakistan, the Russian Federation and the United States) account for 62 per cent of the global total. An examination of the numbers of new cases of HIV diagnosed each year among people who inject drugs provides insight into changes in the epidemic over time and progress towards achieving the target set in the Political Declaration on HIV and AIDS adopted by the General Assembly in 2011 of reducing HIV transmission among people who
inject drugs by 50 per cent by 2015.17 Although the changes in the numbers of newly diagnosed cases may reflect improved surveillance, they also reflect changes in the transmission of HIV within that most-at-risk group. In several European countries18 with a high occurrence of newly diagnosed cases (incidence) of HIV among people who inject drugs, there was a noticeable peak in the number of new cases between 1999 and 2003, indicating that the epidemic in the region was greatest in those years and subsequently declined. That development is visible also in the sharp decline in the number of deaths from AIDS attributed to unsafe injecting drug use that occurred in later years in the western part of the WHO European region,19 with the number of deaths declining from 1,358 in 2006 to 179 in 201220. During that time period, the contribution of unsafe injecting drug use to total AIDSrelated deaths in that region declined from 43 per cent to 25 per cent. The decline in newly diagnosed HIV cases and AIDS-related deaths among people who inject drugs are consistent with the scaling-up of the provision of harm reduction services, a decline in the prevalence of injecting 17 Political Declaration on HIV and AIDS: Intensifying Our Efforts to Eliminate HIV and AIDS (General Assembly resolution 65/277, annex). 18 Countries of Western and Central Europe and Eastern and SouthEastern Europe. 19 For the list of countries of the European region as defined by WHO for the purposes of its work, see www.euro.who.int/en/countries. 20 European Centre for Disease Prevention and Control/WHO Regional Office for Europe. HIV/AIDS surveillance in Europe 2012.
WORLD DRUG REPORT 2014
remains essentially the same. Importantly, the new estimate reflects the results of the first joint UNODC/WHO/ UNAIDS/World Bank data and methodology review and independent expert consultations conducted at the end of 2013, which led to updated national estimates for 36 countries, including the three countries with large populations (China, the Russian Federation and the United States).