1. RECENT STATISTICS AND TREND ANALYSIS OF THE ILLICIT DRUG MARKET
Fig. 4.
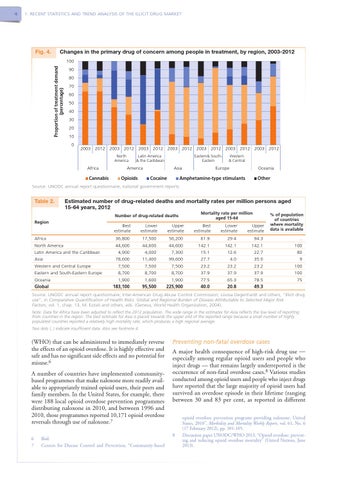
Changes in the primary drug of concern among people in treatment, by region, 2003-2012 100 Proportion of treatment demand (percentage)
4
90 80 70 60 50 40 30 20 10 0
2003 2012 2003 2012 2003 2012 2003 2012 2003 2012 2003 2012 2003 2012 North America
Africa Cannabis
Latin America & the Caribbean
Eastern& SouthEastern
America Opioids
Europe
Asia Cocaine
Western & Central
Oceania
Amphetamine-type stimulants
Other
Source: UNODC annual report questionnaire, national government reports.
Table 2.
Estimated number of drug-related deaths and mortality rates per million persons aged 15-64 years, 2012 Mortality rate per million aged 15-64
Number of drug-related deaths Region
Africa North America Latin America and the Caribbean Asia Western and Central Europe Eastern and South-Eastern Europe Oceania Global
Best estimate
Lower estimate
Upper estimate
Best estimate
Lower estimate
Upper estimate
36,800 44,600 4,900 78,600 7,500 8,700 1,900 183,100
17,500 44,600 4,000 11,400 7,500 8,700 1,600 95,500
56,200 44,600 7,300 99,600 7,500 8,700 1,900 225,900
61.9 142.1 15.1 27.7 23.2 37.9 77.5 40.0
29.4 142.1 12.6 4.0 23.2 37.9 65.3 20.8
94.3 142.1 22.7 35.0 23.2 37.9 78.5 49.3
% of population of countries where mortality data is available
.. 100 80 9 100 100 75
Source: UNODC annual report questionnaire; Inter-American Drug Abuse Control Commission; Louisa Degenhardt and others, “Illicit drug use”, in Comparative Quantification of Health Risks: Global and Regional Burden of Disease Attributable to Selected Major Risk Factors, vol. 1, chap. 13, M. Ezzati and others, eds. (Geneva, World Health Organization, 2004). Note: Data for Africa have been adjusted to reflect the 2012 population. The wide range in the estimates for Asia reflects the low level of reporting from countries in the region. The best estimate for Asia is placed towards the upper end of the reported range because a small number of highly populated countries reported a relatively high mortality rate, which produces a high regional average. Two dots (..) indicate insufficient data. Also see footnote 4.
(WHO) that can be administered to immediately reverse the effects of an opioid overdose. It is highly effective and safe and has no significant side effects and no potential for misuse.6 A number of countries have implemented communitybased programmes that make naloxone more readily available to appropriately trained opioid users, their peers and family members. In the United States, for example, there were 188 local opioid overdose prevention programmes distributing naloxone in 2010, and between 1996 and 2010, those programmes reported 10,171 opioid overdose reversals through use of naloxone.7 6 Ibid. 7 Centers for Disease Control and Prevention, “Community-based
Preventing non-fatal overdose cases
A major health consequence of high-risk drug use — especially among regular opioid users and people who inject drugs — that remains largely underreported is the occurrence of non-fatal overdose cases.8 Various studies conducted among opioid users and people who inject drugs have reported that the large majority of opioid users had survived an overdose episode in their lifetime (ranging between 30 and 83 per cent, as reported in different
8
opioid overdose prevention programs providing naloxone: United States, 2010”, Morbidity and Mortality Weekly Report, vol. 61, No. 6 (17 February 2012), pp. 101-105. Discussion paper UNODC/WHO 2013, “Opioid overdose: preventing and reducing opioid overdose mortality” (United Nations, June 2013).