181
Annex tables
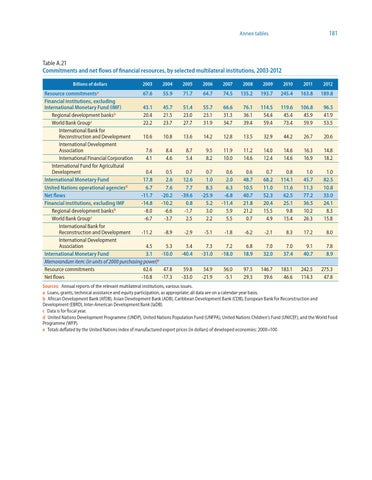
Table A.21 Commitments and net flows of financial resources, by selected multilateral institutions, 2003-2012 Billions of dollars
Resource commitmentsa
2003
67.6 Financial institutions, excluding International Monetary Fund (IMF) 43.1 20.4 Regional development banksb c 22.2 World Bank Group International Bank for Reconstruction and Development 10.6 International Development Association 7.6 International Financial Corporation 4.1 International Fund for Agricultural Development 0.4 International Monetary Fund 17.8 6.7 United Nations operational agenciesd Net flows -11.7 Financial institutions, excluding IMF -14.8 -8.0 Regional development banksb -6.7 World Bank Groupc International Bank for Reconstruction and Development -11.2 International Development Association 4.5 International Monetary Fund 3.1 Memorandum item: (in units of 2000 purchasing power)e Resource commitments 62.6 Net flows -10.8
2004
2005
2006
2007
2008
2009
2010
2011
2012
55.9
71.7
64.7
74.5
135.2
193.7
245.4
163.8
189.8
45.7 21.5 23.7
51.4 23.0 27.7
55.7 23.1 31.9
66.6 31.3 34.7
76.1 36.1 39.4
114.5 54.4 59.4
119.6 45.4 73.4
106.8 45.9 59.9
96.5 41.9 53.5
10.8
13.6
14.2
12.8
13.5
32.9
44.2
26.7
20.6
8.4 4.6
8.7 5.4
9.5 8.2
11.9 10.0
11.2 14.6
14.0 12.4
14.6 14.6
16.3 16.9
14.8 18.2
0.5 2.6 7.6 -20.2 -10.2 -6.6 -3.7
0.7 12.6 7.7 -39.6 0.8 -1.7 2.5
0.7 1.0 8.3 -25.9 5.2 3.0 2.2
0.6 2.0 6.3 -6.8 -11.4 5.9 5.5
0.6 48.7 10.5 40.7 21.8 21.2 0.7
0.7 68.2 11.0 52.3 20.4 15.5 4.9
0.8 114.1 11.6 62.5 25.1 9.8 15.4
1.0 45.7 11.3 77.2 36.5 10.2 26.3
1.0 82.5 10.8 33.0 24.1 8.3 15.8
-8.9
-2.9
-5.1
-1.8
-6.2
-2.1
8.3
17.2
8.0
5.3 -10.0
5.4 -40.4
7.3 -31.0
7.2 -18.0
6.8 18.9
7.0 32.0
7.0 37.4
9.1 40.7
7.8 8.9
47.8 -17.3
59.8 -33.0
54.9 -21.9
56.0 -5.1
97.3 29.3
146.7 39.6
183.1 46.6
242.5 114.3
275.3 47.8
Sources: Annual reports of the relevant multilateral institutions, various issues. a Loans, grants, technical assistance and equity participation, as appropriate; all data are on a calendar-year basis. b African Development Bank (AfDB), Asian Development Bank (ADB), Caribbean Development Bank (CDB), European Bank for Reconstruction and Development (EBRD), Inter-American Development Bank (IaDB). c Data is for fiscal year. d United Nations Development Programme (UNDP), United Nations Population Fund (UNFPA), United Nations Children’s Fund (UNICEF), and the World Food Programme (WFP). e Totals deflated by the United Nations index of manufactured export prices (in dollars) of developed economies: 2000=100.