180
World Economic Situation and Prospects 2014
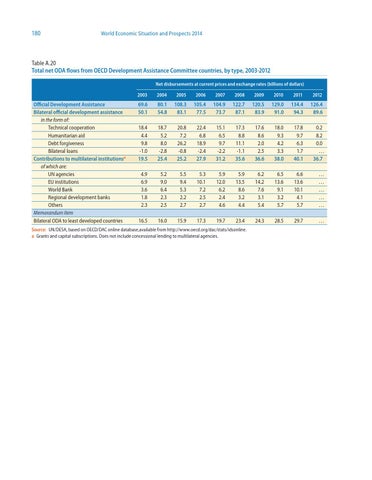
Table A.20 Total net ODA flows from OECD Development Assistance Committee countries, by type, 2003-2012 Net disbursements at current prices and exchange rates (billions of dollars)
Official Development Assistance Bilateral official development assistance in the form of: Technical cooperation Humanitarian aid Debt forgiveness Bilateral loans Contributions to multilateral institutionsa of which are: UN agencies EU institutions World Bank Regional development banks Others Memorandum item Bilateral ODA to least developed countries
2003
2004
2005
2006
2007
2008
2009
2010
2011
2012
69.6 50.1
80.1 54.8
108.3 83.1
105.4 77.5
104.9 73.7
122.7 87.1
120.5 83.9
129.0 91.0
134.4 94.3
126.4 89.6
18.4 4.4 9.8 -1.0 19.5
18.7 5.2 8.0 -2.8 25.4
20.8 7.2 26.2 -0.8 25.2
22.4 6.8 18.9 -2.4 27.9
15.1 6.5 9.7 -2.2 31.2
17.3 8.8 11.1 -1.1 35.6
17.6 8.6 2.0 2.5 36.6
18.0 9.3 4.2 3.3 38.0
17.8 9.7 6.3 1.7 40.1
0.2 8.2 0.0 … 36.7
4.9 6.9 3.6 1.8 2.3
5.2 9.0 6.4 2.3 2.5
5.5 9.4 5.3 2.2 2.7
5.3 10.1 7.2 2.5 2.7
5.9 12.0 6.2 2.4 4.6
5.9 13.5 8.6 3.2 4.4
6.2 14.2 7.6 3.1 5.4
6.5 13.6 9.1 3.2 5.7
6.6 13.6 10.1 4.1 5.7
… … … … …
16.5
16.0
15.9
17.3
19.7
23.4
24.3
28.5
29.7
…
Source: UN/DESA, based on OECD/DAC online database,available from http://www.oecd.org/dac/stats/idsonline. a Grants and capital subscriptions. Does not include concessional lending to multilateral agencies.