176
World Economic Situation and Prospects 2014
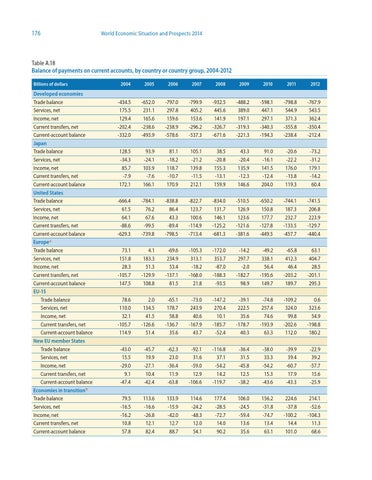
Table A.18 Balance of payments on current accounts, by country or country group, 2004-2012 Billions of dollars
2004
2005
2006
2007
2008
2009
2010
2011
2012
Trade balance
-434.5
-652.0
-797.0
-799.9
-932.5
-488.2
-598.1
-798.8
-767.9
Services, net
175.5
231.1
297.8
405.2
445.6
389.0
447.1
544.9
543.5
Developed economies
129.4
165.6
159.6
153.6
141.9
197.1
297.1
371.3
362.4
Current transfers, net
Income, net
-202.4
-238.6
-238.9
-296.2
-326.7
-319.3
-340.3
-355.8
-350.4
Current-account balance
-332.0
-493.9
-578.6
-537.3
-671.6
-221.3
-194.3
-238.4
-212.4
Trade balance
128.5
93.9
81.1
105.1
38.5
43.3
91.0
-20.6
-73.2
Services, net
-34.3
-24.1
-18.2
-21.2
-20.8
-20.4
-16.1
-22.2
-31.2
Income, net
85.7
103.9
118.7
139.8
155.3
135.9
141.5
176.0
179.1
Japan
Current transfers, net Current-account balance
-7.9
-7.6
-10.7
-11.5
-13.1
-12.3
-12.4
-13.8
-14.2
172.1
166.1
170.9
212.1
159.9
146.6
204.0
119.3
60.4
-666.4
-784.1
-838.8
-822.7
-834.0
-510.5
-650.2
-744.1
-741.5
61.5
76.2
86.4
123.7
131.7
126.9
150.8
187.3
206.8
United States Trade balance Services, net Income, net
64.1
67.6
43.3
100.6
146.1
123.6
177.7
232.7
223.9
-88.6
-99.5
-89.4
-114.9
-125.2
-121.6
-127.8
-133.5
-129.7
-629.3
-739.8
-798.5
-713.4
-681.3
-381.6
-449.5
-457.7
-440.4
Trade balance
73.1
4.1
-69.6
-105.3
-172.0
-14.2
-49.2
-65.8
63.1
Services, net
151.8
183.3
234.9
313.1
353.7
297.7
338.1
412.3
404.7
Income, net
28.3
51.3
53.4
-18.2
-87.0
-2.0
56.4
46.4
28.5
Current transfers, net
-105.7
-129.9
-137.1
-168.0
-188.3
-182.7
-195.6
-203.2
-201.1
Current-account balance
147.5
108.8
81.5
21.8
-93.5
98.9
149.7
189.7
295.3
Current transfers, net Current-account balance Europe
a
EU-15 Trade balance
78.6
2.0
-65.1
-73.0
-147.2
-39.1
-74.8
-109.2
0.6
Services, net
110.0
134.5
178.7
243.9
270.4
222.5
257.4
324.0
323.6
Income, net
32.1
41.5
58.8
40.6
10.1
35.6
74.6
99.8
54.9
Current transfers, net
-105.7
-126.6
-136.7
-167.9
-185.7
-178.7
-193.9
-202.6
-198.8
Current-account balance
114.9
51.4
35.6
43.7
-52.4
40.3
63.3
112.0
180.2
New EU member States Trade balance
-43.0
-45.7
-62.3
-92.1
-116.8
-36.4
-38.0
-39.9
-22.9
Services, net
15.5
19.9
23.0
31.6
37.1
31.5
33.3
39.4
39.2
Income, net
-29.0
-27.1
-36.4
-59.0
-54.2
-45.8
-54.2
-60.7
-57.7
9.1
10.4
11.9
12.9
14.2
12.5
15.3
17.9
15.6
-47.4
-42.4
-63.8
-106.6
-119.7
-38.2
-43.6
-43.3
-25.9
79.5
113.6
133.9
114.6
177.4
106.0
156.2
224.6
214.1
Current transfers, net Current-account balance Economies in transition b Trade balance Services, net
-16.5
-16.6
-15.9
-24.2
-28.5
-24.5
-31.8
-37.8
-52.6
Income, net
-16.2
-26.8
-42.0
-48.3
-72.7
-59.4
-74.7
-100.2
-104.3
Current transfers, net
10.8
12.1
12.7
12.0
14.0
13.6
13.4
14.4
11.3
Current-account balance
57.8
82.4
88.7
54.1
90.2
35.6
63.1
101.0
68.6