174
World Economic Situation and Prospects 2014
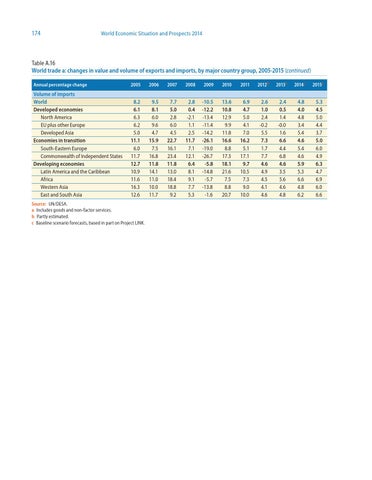
Table A.16 World trade a: changes in value and volume of exports and imports, by major country group, 2005-2015 (continued) Annual percentage change
2005
2006
2007
2008
2009
2010
2011
2012b
2013c
2014c
2015c
Volume of imports World Developed economies North America EU plus other Europe Developed Asia Economies in transition South-Eastern Europe Commonwealth of Independent States Developing economies Latin America and the Caribbean Africa Western Asia East and South Asia
8.2 6.1 6.3 6.2 5.0 11.1 6.0 11.7 12.7 10.9 11.6 16.3 12.6
9.5 8.1 6.0 9.6 4.7 15.9 7.5 16.8 11.8 14.1 11.0 10.0 11.7
7.7 5.0 2.8 6.0 4.5 22.7 16.1 23.4 11.8 13.0 18.4 18.8 9.2
2.8 0.4 -2.1 1.1 2.5 11.7 7.1 12.1 6.4 8.1 9.1 7.7 5.3
-10.5 -12.2 -13.4 -11.4 -14.2 -26.1 -19.0 -26.7 -5.8 -14.8 -5.7 -13.8 -1.6
13.6 10.8 12.9 9.9 11.8 16.6 8.8 17.3 18.1 21.6 7.5 8.8 20.7
6.9 4.7 5.0 4.1 7.0 16.2 5.1 17.1 9.7 10.5 7.3 9.0 10.0
2.6 1.0 2.4 -0.2 5.5 7.3 1.7 7.7 4.6 4.9 4.5 4.1 4.6
2.4 0.5 1.4 -0.0 1.6 6.6 4.4 6.8 4.6 3.5 5.6 4.6 4.8
4.8 4.0 4.8 3.4 5.4 4.6 5.4 4.6 5.9 5.3 6.6 4.8 6.2
5.3 4.5 5.0 4.4 3.7 5.0 6.0 4.9 6.3 4.7 6.9 6.0 6.6
Source: UN/DESA. a Includes goods and non-factor services. b Partly estimated. c Baseline scenario forecasts, based in part on Project LINK.