173
Annex tables
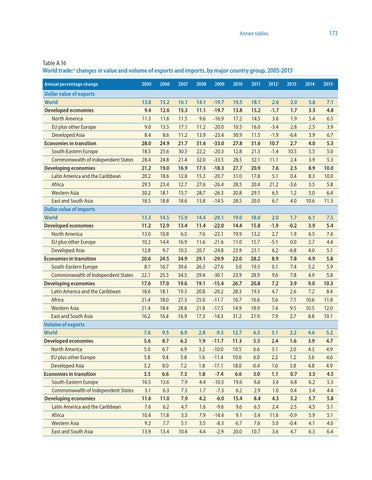
Table A.16 World trade:a changes in value and volume of exports and imports, by major country group, 2005-2015 Annual percentage change
2005
2006
2007
2008
2009
2010
2011
2012b
2013c
2014c
2015c
Dollar value of exports World Developed economies North America EU plus other Europe Developed Asia
13.8
15.2
16.1
14.1
-19.7
19.5
18.1
2.6
2.0
5.8
7.1
9.4
12.6
15.3
11.1
-19.7
13.8
15.2
-1.7
1.7
3.3
4.8
11.3
11.6
11.5
9.6
-16.9
17.2
14.5
3.6
1.9
5.4
6.5
9.0
13.5
17.1
11.2
-20.0
10.5
16.0
-3.4
2.8
2.5
3.9
8.4
8.6
11.2
13.9
-23.4
30.9
11.5
-1.9
-6.4
3.9
6.7
Economies in transition
28.0
24.9
21.7
31.6
-33.0
27.8
31.6
10.7
2.7
4.0
5.3
South-Eastern Europe
18.5
25.6
30.5
22.2
-20.3
12.8
21.3
-1.4
10.5
5.5
5.0
Commonwealth of Independent States Developing economies
28.4
24.8
21.4
32.0
-33.5
28.5
32.1
11.1
2.4
3.9
5.3
21.2
19.0
16.9
17.3
-18.3
27.7
20.9
7.6
2.5
8.9
10.0 10.0
Latin America and the Caribbean
20.2
18.6
12.8
15.3
-20.7
31.0
17.8
5.1
0.4
8.3
Africa
29.5
23.4
12.7
27.6
-26.4
28.5
20.4
21.2
-3.6
3.5
5.8
Western Asia
30.2
18.1
15.7
28.7
-26.3
20.8
29.1
6.5
1.2
5.0
6.4
East and South Asia
18.5
18.8
18.6
13.8
-14.5
28.5
20.0
6.7
4.0
10.6
11.3
Dollar value of imports World
13.3
14.5
15.9
14.4
-20.1
19.0
18.0
2.0
1.7
6.1
7.5
Developed economies
11.2
12.9
13.4
11.4
-22.0
14.4
15.8
-1.9
-0.2
3.9
5.4
13.0
10.8
6.5
7.6
-22.1
19.9
13.2
2.7
1.9
6.5
7.4
EU plus other Europe
10.2
14.4
16.9
11.6
-21.6
11.0
15.7
-5.1
0.0
2.7
4.4
Developed Asia
12.8
9.7
10.5
20.7
-24.8
23.9
23.1
6.2
-6.8
4.0
5.1
Economies in transition
20.6
24.5
34.9
29.1
-29.9
22.0
28.2
8.9
7.8
4.9
5.8
South-Eastern Europe
8.1
16.7
39.6
26.3
-27.6
3.0
19.3
0.1
7.4
5.2
5.9
22.1
25.3
34.5
29.4
-30.1
23.9
28.9
9.6
7.8
4.9
5.8
17.6
17.0
19.6
19.1
-15.4
26.7
20.8
7.2
3.9
9.0
10.3
18.6
18.1
19.3
20.8
-20.2
28.3
19.3
4.7
2.6
7.2
8.4
North America
Commonwealth of Independent States Developing economies Latin America and the Caribbean Africa
21.4
18.0
27.3
25.0
-11.7
10.7
16.6
5.6
7.1
10.6
11.8
Western Asia
21.4
18.4
28.8
21.8
-17.5
14.9
18.9
7.4
9.5
10.5
12.0
East and South Asia
16.2
16.4
16.9
17.3
-14.3
31.2
21.9
7.9
2.7
8.8
10.1
Volume of exports World
7.6
9.5
6.9
2.8
-9.3
12.7
6.5
3.1
2.2
4.6
5.2
Developed economies
5.6
8.7
6.2
1.9
-11.7
11.3
5.5
2.4
1.6
3.9
4.7
North America
5.0
6.7
6.9
3.2
-10.0
10.5
6.6
3.1
2.0
4.3
4.9
EU plus other Europe
5.8
9.4
5.8
1.6
-11.4
10.6
6.0
2.2
1.2
3.6
4.6
Developed Asia Economies in transition South-Eastern Europe Commonwealth of Independent States Developing economies Latin America and the Caribbean Africa Western Asia East and South Asia
5.2
8.0
7.2
1.8
-17.1
18.0
-0.4
1.6
3.8
4.8
4.9
3.5
6.6
7.3
1.8
-7.4
6.6
3.0
1.1
0.7
3.5
4.5
16.5
13.6
7.9
4.4
-10.3
19.6
6.6
3.4
6.8
6.2
5.3
3.1
6.3
7.3
1.7
-7.3
6.2
2.9
1.0
0.4
3.4
4.4
11.6
11.0
7.9
4.2
-6.0
15.4
8.4
4.3
3.2
5.7
5.8
7.6
6.2
4.7
1.6
-9.6
9.6
6.5
2.4
2.5
4.5
5.1
10.4
11.8
3.3
7.9
-14.4
9.1
-3.4
11.6
-0.9
5.9
5.1
9.2
7.7
5.1
3.5
-8.3
6.7
7.6
5.0
-0.4
4.1
4.0
13.9
13.4
10.4
4.4
-2.9
20.0
10.7
3.6
4.7
6.3
6.4