172
World Economic Situation and Prospects 2014
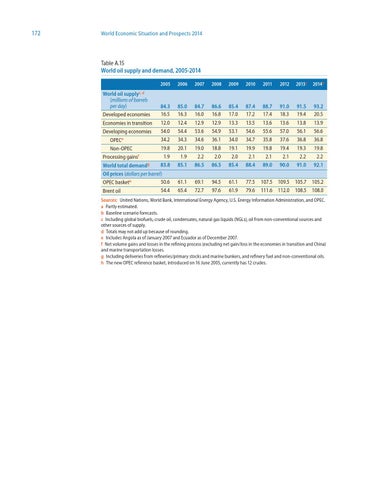
Table A.15 World oil supply and demand, 2005-2014
World oil supplyc, d (millions of barrels per day) Developed economies
2005
2006
2007
2008
2009
2010
2011
2012
2013a
2014b
84.3 16.5
85.0 16.3
84.7 16.0
86.6 16.8
85.4 17.0
87.4 17.2
88.7 17.4
91.0 18.3
91.5 19.4
93.2 20.5
Economies in transition
12.0
12.4
12.9
12.9
13.3
13.5
13.6
13.6
13.8
13.9
Developing economies
54.0
54.4
53.6
54.9
53.1
54.6
55.6
57.0
56.1
56.6
OPECe
34.2
34.3
34.6
36.1
34.0
34.7
35.8
37.6
36.8
36.8
Non-OPEC
19.8
20.1
19.0
18.8
19.1
19.9
19.8
19.4
19.3
19.8
Processing gainsf World total demandg
1.9
1.9
2.2
2.0
2.0
2.1
2.1
2.1
2.2
2.2
83.8
85.1
86.5
86.5
85.4
88.4
89.0
90.0
91.0
92.1
Oil prices (dollars per barrel) 50.6 OPEC basketh
61.1
69.1
94.5
61.1
77.5
107.5
109.5
105.7
105.2
54.4
65.4
72.7
97.6
61.9
79.6
111.6
112.0
108.5
108.0
Brent oil
Sources: United Nations, World Bank, International Energy Agency, U.S. Energy Information Administration, and OPEC. a Partly estimated. b Baseline scenario forecasts. c Including global biofuels, crude oil, condensates, natural gas liquids (NGLs), oil from non-conventional sources and other sources of supply. d Totals may not add up because of rounding. e Includes Angola as of January 2007 and Ecuador as of December 2007. f Net volume gains and losses in the refining process (excluding net gain/loss in the economies in transition and China) and marine transportation losses. g Including deliveries from refineries/primary stocks and marine bunkers, and refinery fuel and non-conventional oils. h The new OPEC reference basket, introduced on 16 June 2005, currently has 12 crudes.