171
Annex tables
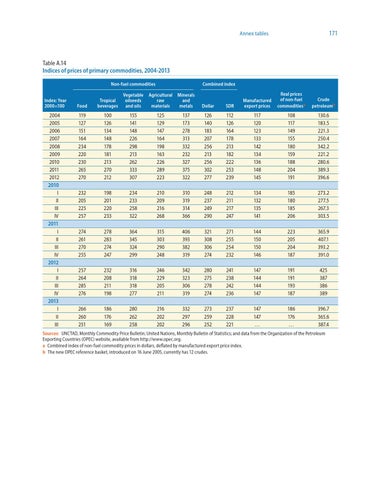
Table A.14 Indices of prices of primary commodities, 2004-2013 Non-fuel commodities Index: Year 2000=100
2004 2005 2006 2007 2008 2009 2010 2011 2012 2010 I II III IV 2011 I II III IV 2012 I II III IV 2013 I II III
Combined index
SDR
Manufactured export prices
Real prices of non-fuel commoditiesa
Crude petroleumb
126 140 183 207 256 213 256 302 277
112 126 164 178 213 182 222 253 239
117 120 123 133 142 134 136 148 145
108 117 149 155 180 159 188 204 191
130.6 183.5 221.3 250.4 342.2 221.2 280.6 389.3 396.6
310 319 314 366
248 237 249 290
212 211 217 247
134 132 135 141
185 180 185 206
273.2 277.5 267.3 303.5
315 303 290 248
406 393 382 319
321 308 306 274
271 255 254 232
144 150 150 146
223 205 204 187
365.9 407.1 393.2 391.0
316 318 318 277
246 229 205 211
342 323 306 319
280 275 278 274
241 238 242 236
147 144 144 147
191 191 193 187
425 387 386 389
280 262 258
216 202 202
332 297 296
273 259 252
237 228 221
147 147 …
186 176 …
396.7 365.6 387.4
Food
Tropical beverages
Vegetable oilseeds and oils
Agricultural raw materials
Minerals and metals
Dollar
119 127 151 164 234 220 230 265 270
100 126 134 148 178 181 213 270 212
155 141 148 226 298 213 262 333 307
125 129 147 164 198 163 226 289 223
137 173 278 313 332 232 327 375 322
232 205 225 257
198 201 220 233
234 233 258 322
210 209 216 268
274 261 270 255
278 283 274 247
364 345 324 299
257 264 285 276
232 208 211 198
266 260 251
186 176 169
Sources: UNCTAD, Monthly Commodity Price Bulletin; United Nations, Monthly Bulletin of Statistics; and data from the Organization of the Petroleum Exporting Countries (OPEC) website, available from http://www.opec.org. a Combined index of non-fuel commodity prices in dollars, deflated by manufactured export price index. b The new OPEC reference basket, introduced on 16 June 2005, currently has 12 crudes.