170
World Economic Situation and Prospects 2014
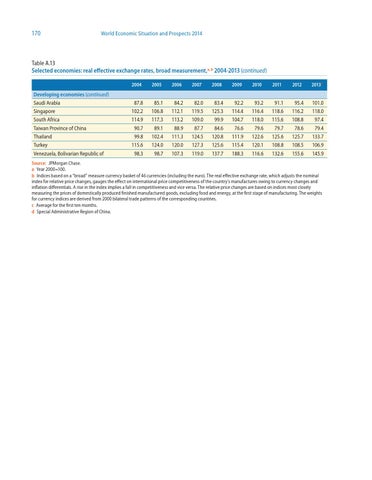
Table A.13 Selected economies: real effective exchange rates, broad measurement,a, b 2004-2013 (continued) 2004
2005
2006
2007
2008
2009
2010
2011
2012
2013c
Developing economies (continued) Saudi Arabia
87.8
85.1
84.2
82.0
83.4
92.2
93.2
91.1
95.4
101.0
Singapore
102.2
106.8
112.1
119.5
125.3
114.4
116.4
118.6
116.2
118.0
South Africa
114.9
117.3
113.2
109.0
99.9
104.7
118.0
115.6
108.8
97.4
Taiwan Province of China
90.7
89.1
88.9
87.7
84.6
76.6
79.6
79.7
78.6
79.4
Thailand
99.8
102.4
111.3
124.5
120.8
111.9
122.6
125.6
125.7
133.7
115.6
124.0
120.0
127.3
125.6
115.4
120.1
108.8
108.5
106.9
98.3
98.7
107.3
119.0
137.7
188.3
116.6
132.6
155.6
145.9
Turkey Venezuela, Bolivarian Republic of
Source: JPMorgan Chase. a Year 2000=100. b Indices based on a “broad” measure currency basket of 46 currencies (including the euro). The real effective exchange rate, which adjusts the nominal index for relative price changes, gauges the effect on international price competitiveness of the country’s manufactures owing to currency changes and inflation differentials. A rise in the index implies a fall in competitiveness and vice versa. The relative price changes are based on indices most closely measuring the prices of domestically produced finished manufactured goods, excluding food and energy, at the first stage of manufacturing. The weights for currency indices are derived from 2000 bilateral trade patterns of the corresponding countries. c Average for the first ten months. d Special Administrative Region of China.